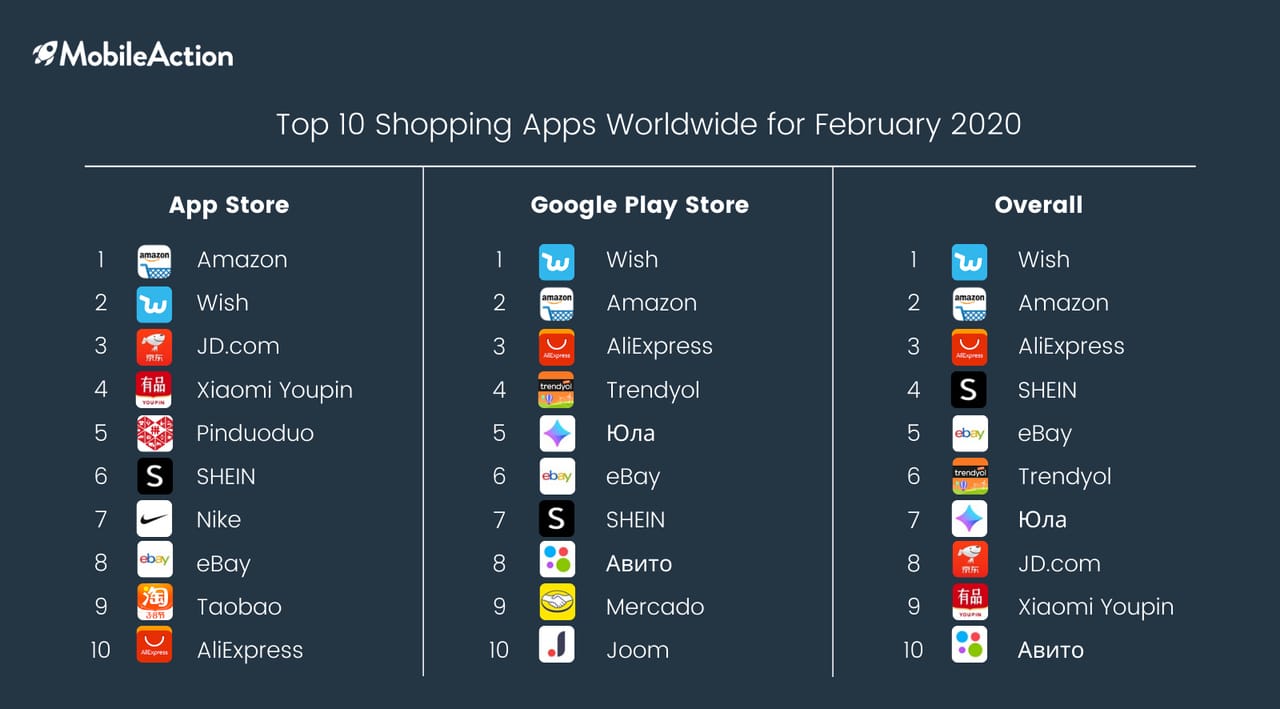
The above chart shows the Top 10 Shopping Apps Worldwide in February 2020 for the App Store, Google Play Store, and both stores combined. While Amazon and Wish are fighting for the number 1 position in both stores, Wish seems to be the overall champion with more than 8M downloads. We observed that the listed top 10 shopping apps in the Google Play Store got almost 74% more downloads than the ones in the App Store. This is the reason why we see the apps that managed to get in the overall list are mainly the apps in the list of Google Play Store.
We see a clear dominance of Chinese app publishers in the App Store while the Google Play Store has a variety of different app publishers such as Trendyol from Turkey, Youla (Юла) from Russia, and Mercado from Argentine. Other than Amazon and Wish, the shopping apps are all localized to one specific country, which limits the download numbers based on the few countries they operate.
To get a better understanding of how Amazon and Wish were able to get successful on the international scale, we took a detailed look at their paid user acquisition strategy.
Wish and Amazon as Top Advertisers
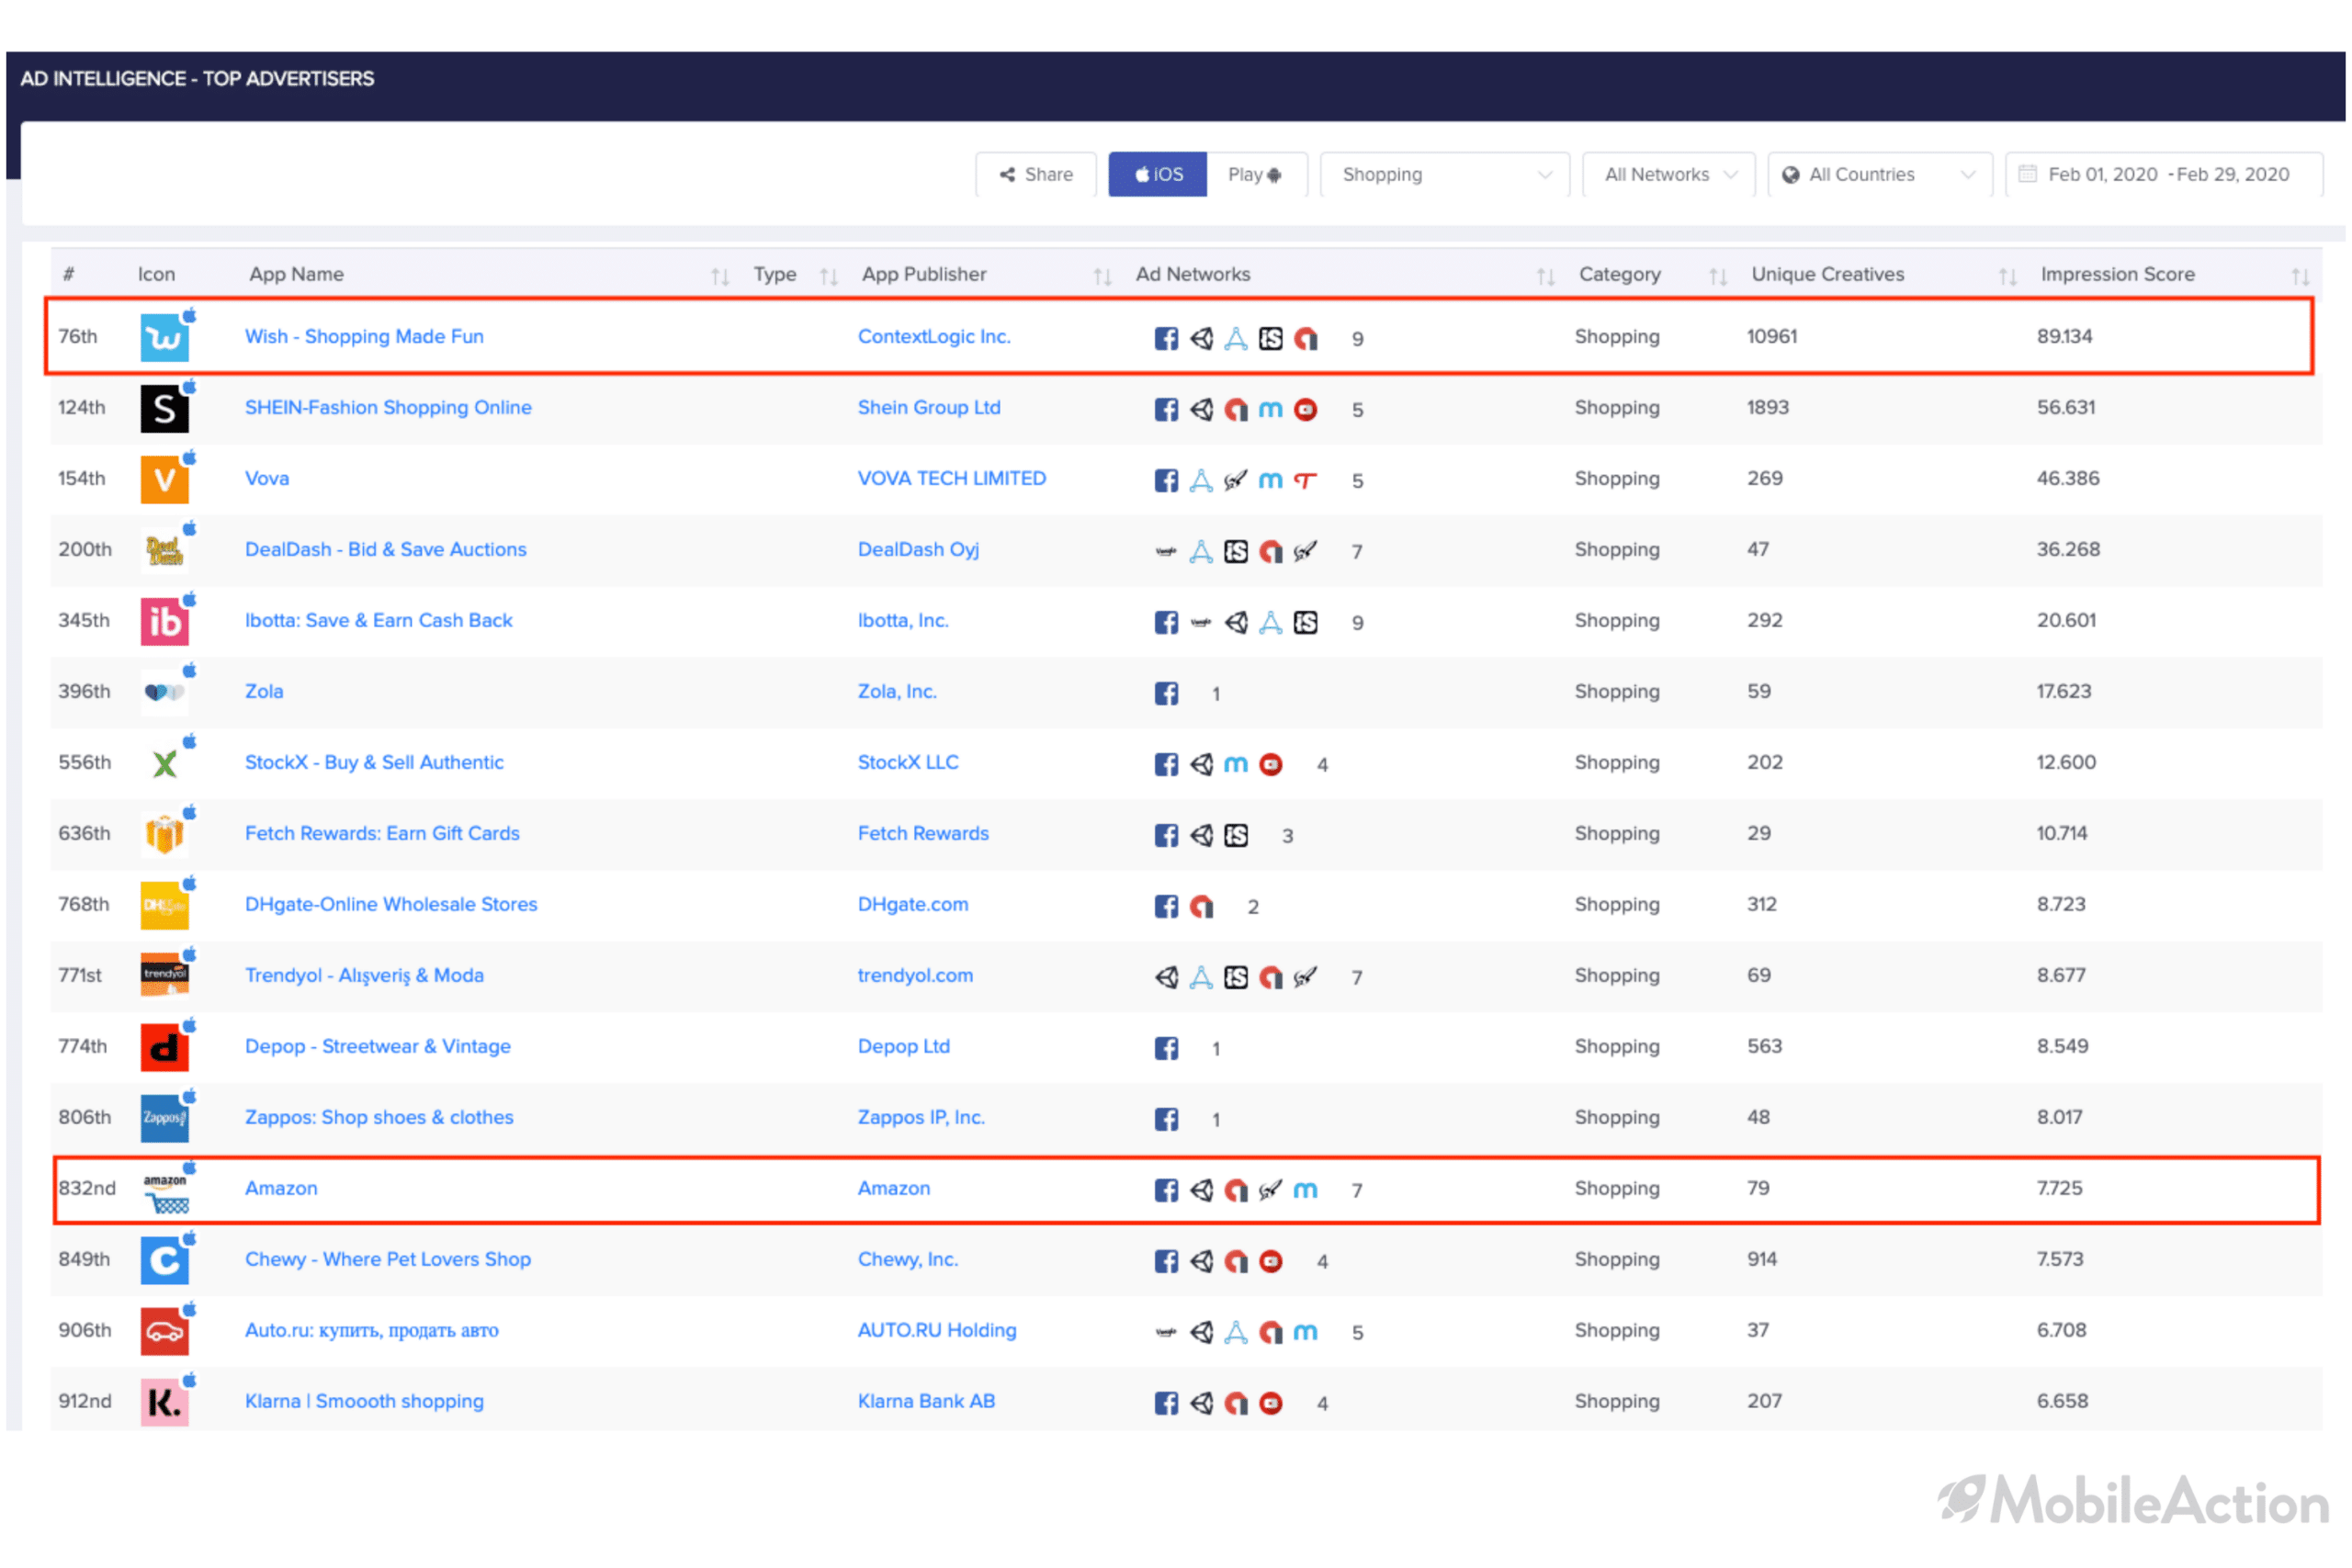
We checked the Top Advertisers list under Ad Intelligence to understand which shopping apps have got better results in the form of impression scores from their in-app ad performance. We filtered all shopping apps and adjusted the time window from Feb. 1st to Feb. 29th to see their performance for the last month only.
The general picture above shows us that Wish is the most aggressive shopping app in terms of utilizing in-app ads to get more downloads. Looking at all iOS advertisers, Wish is the only shopping app that managed to get in the top 100. Its closest competitor in terms of the download numbers, Amazon, ranks way below Wish. So we can clearly say that although Amazon gets the upper hand in the downloads, Wish is doing its best on the paid side to catch up with Amazon.

Apps in the Google Play Store are even more competitive than their iOS counterparts. Wish still gets the first place among all the shopping apps in Play Store, and more importantly, it ranks 12th in the overall list! Android version of Amazon seems to be using in-app ads more than its iOS app. Yet, it still ranks quite low compared to Wish.
Now, let’s take a more detailed look at the campaign analysis page of Wish in the Play Store to understand the key metrics of its paid user acquisition strategy.
Campaign Metrics of Wish
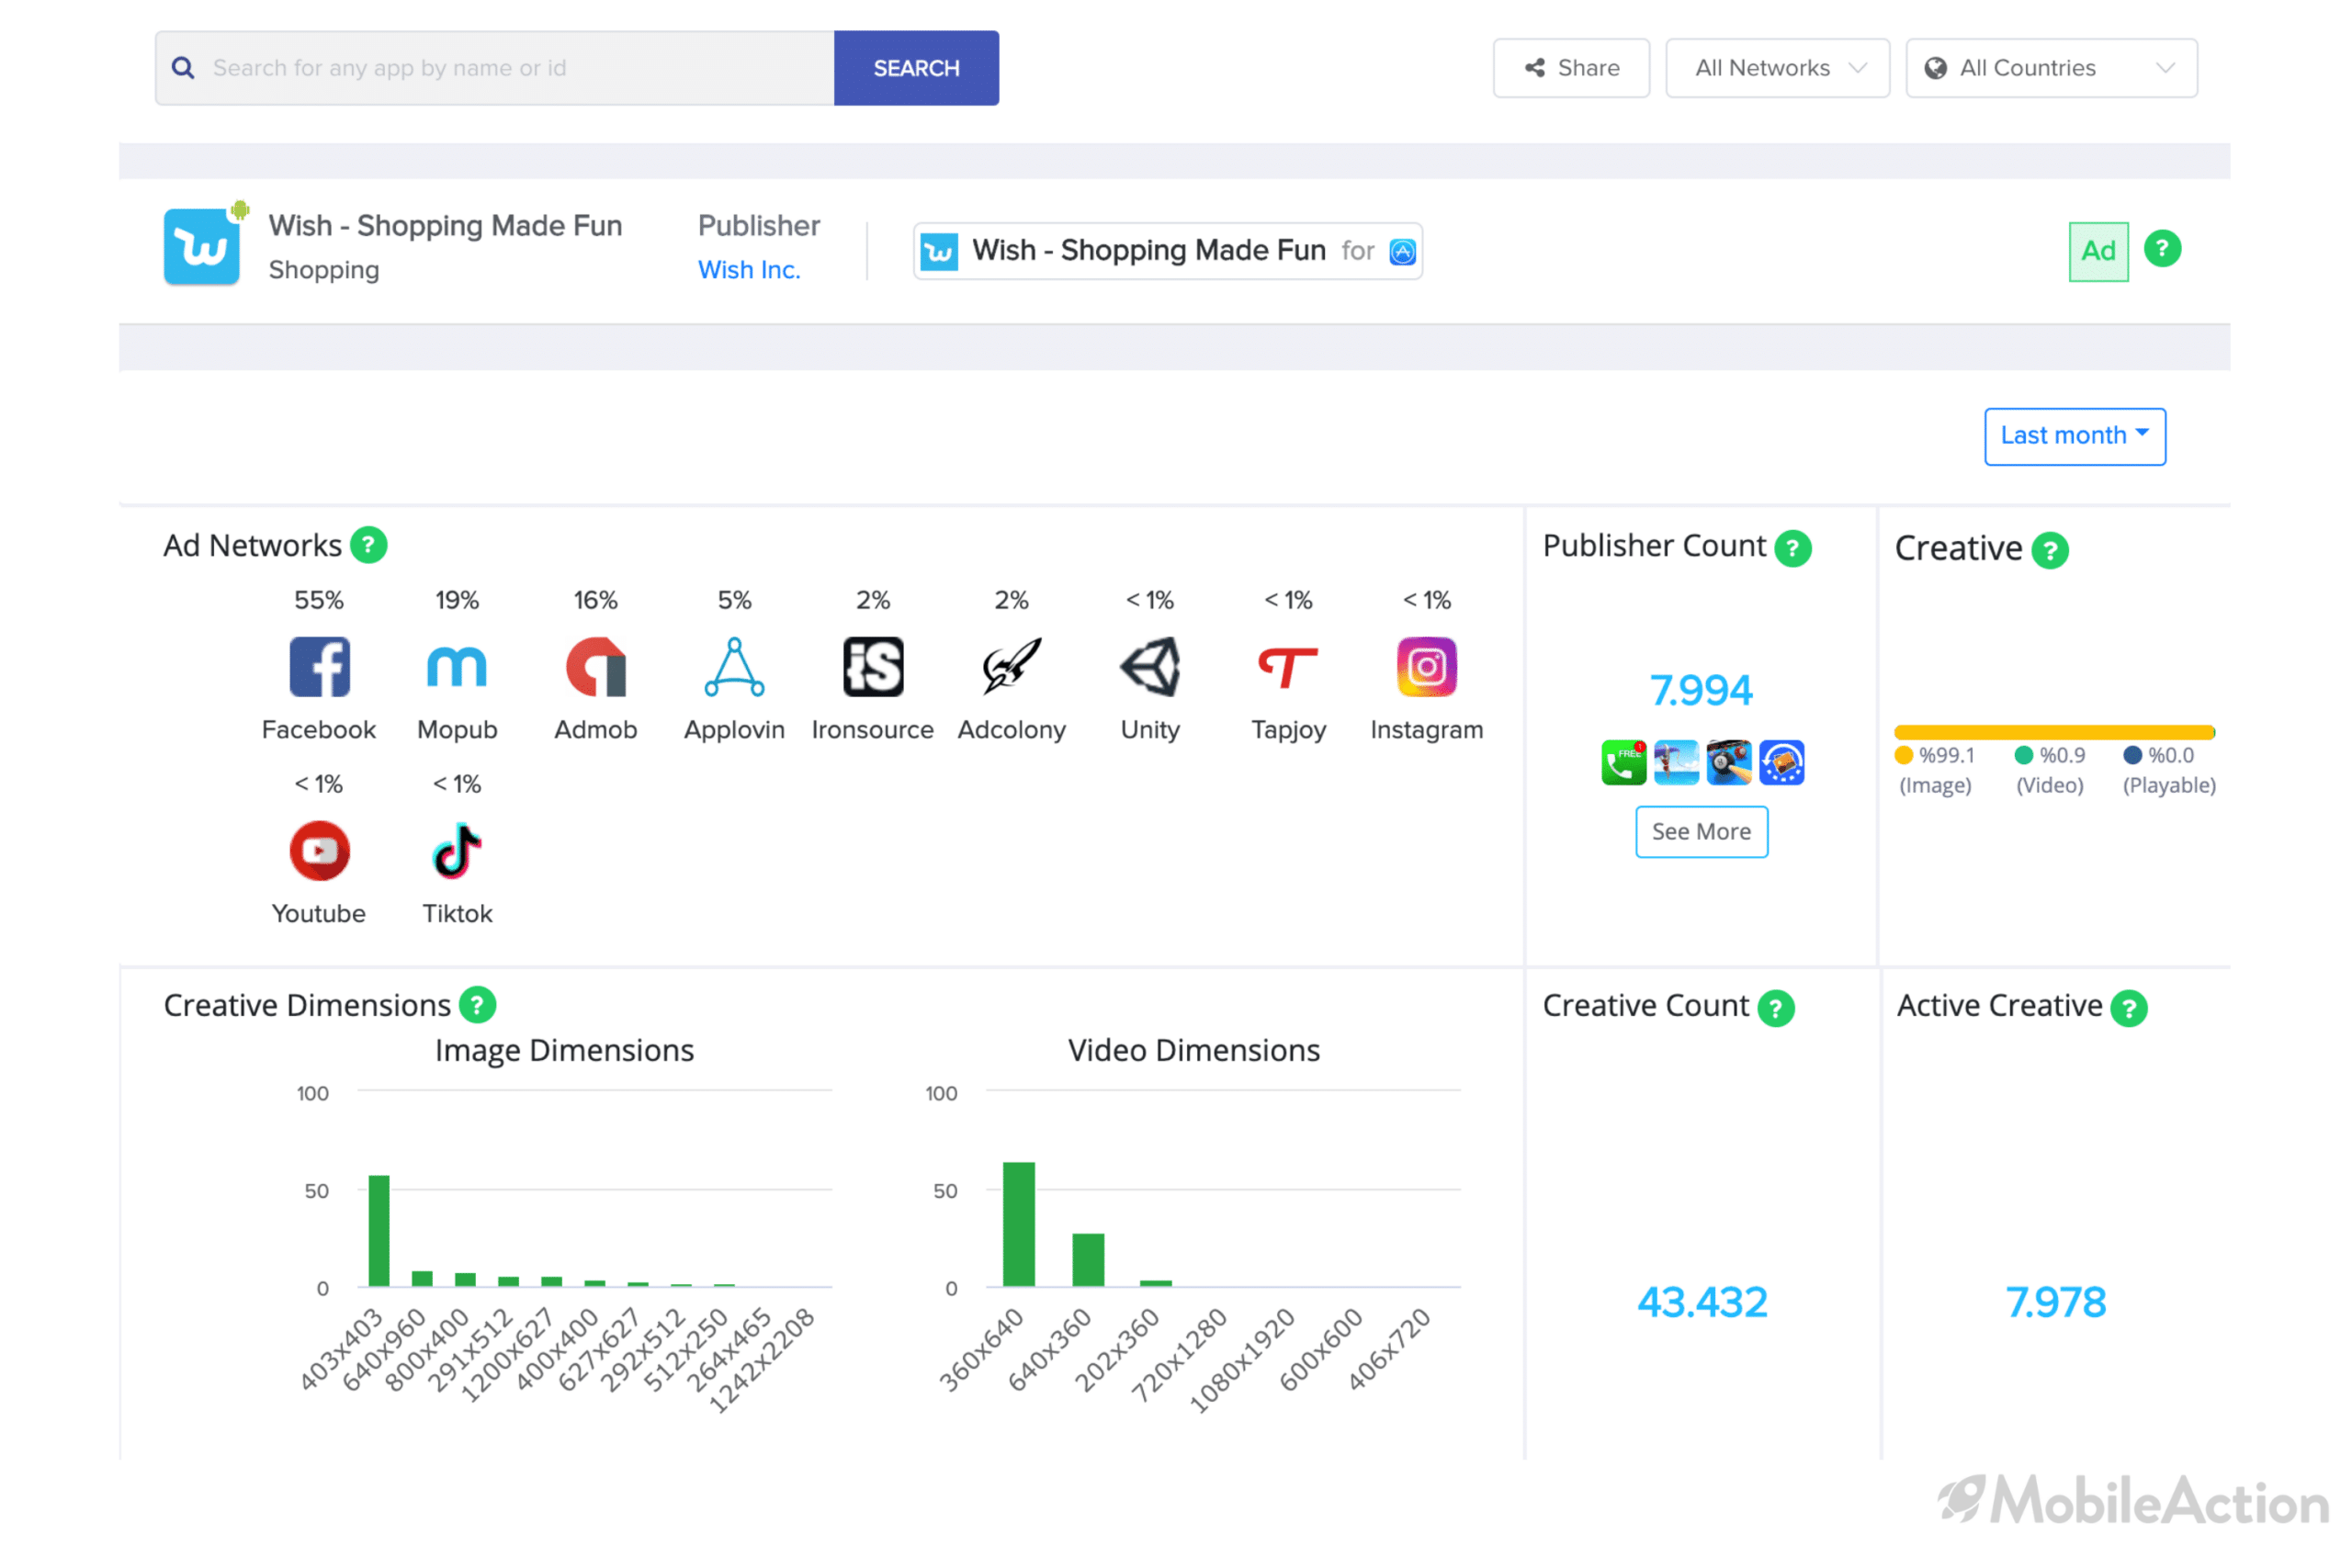
In the last month, Wish used 11 different ad networks and published its ads in 7,994 apps. It has used a total of 43,432 creatives out of which 7,978 are active. This shows that Wish is conducting many A/B tests to figure out which creatives perform better.

The above graphs and figures show the countries that the ads of Wish are running and the languages it is using in the ads. The countries listed on the top left are sorted based on where the ads appear most. It turns out that Wish is mainly targeting shoppers in the US and shows ads in English mostly. As Greece and Sweden are also in the top 5 targeted countries, a small percentage of its ads are in those languages.
The distribution share below shows us how the percentage share of ads in different countries has changed over the month. At the beginning of February, 17% of the ads were allocated to the US, but towards the end of the month, it went down to 12%.
Let’s take a look at the best performing creative of Wish to see what specific strategies they used.
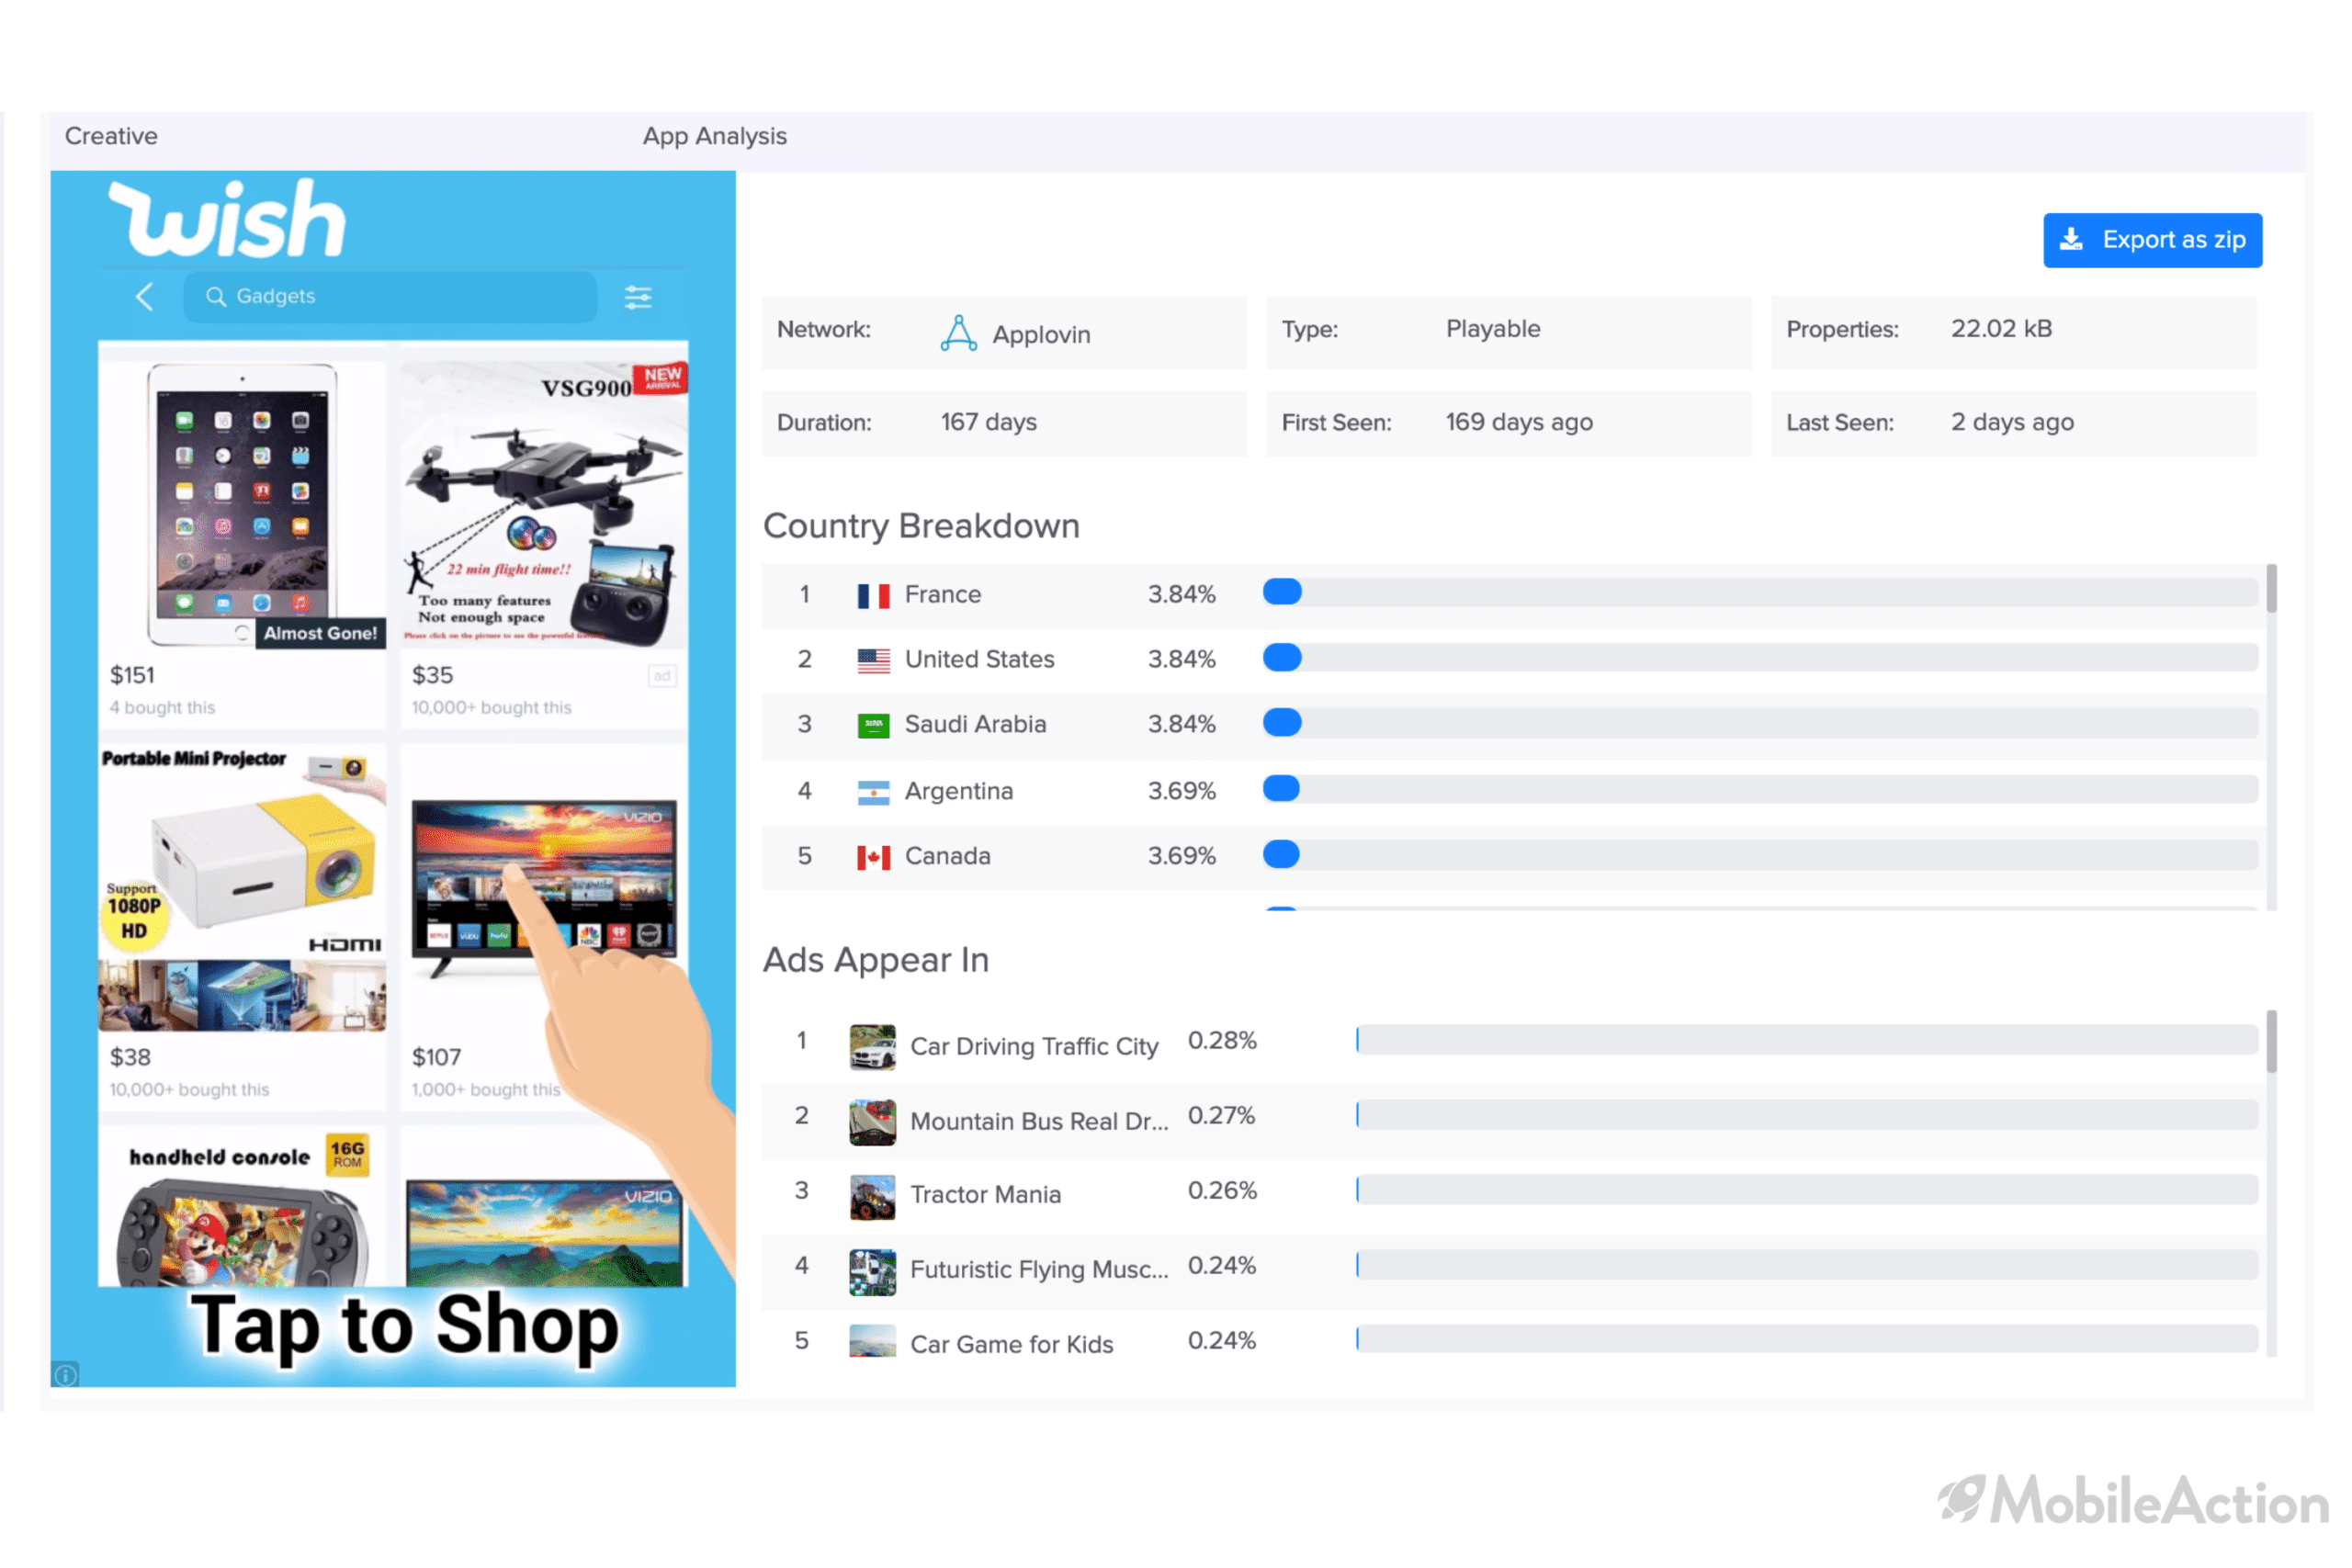
5.93% of the impressions of Wish comes from the above playable creative. When you think that Wish has thousands of creatives as we mentioned before, this percentage is quite huge for only one creative. But there is a more interesting thing here. Wish opted in for using a playable creative, a preference that we normally observe in the games.
If you check the apps that this ad is shown, you’ll see that they are mostly games. Realized the trick here? 🙂 Although Wish is a shopping app, they followed a different strategy and used a playable ad in more than 1450 games to capture the gamers. When you think that people generally spend their free time playing games, watching a video or online shopping, it makes quite a sense to target gamers with a playable ad, don’t you think so?
If you’re curious about how the iOS app of Wish performed, feel free to check out the Campaign Analysis page of it here.
Now, you might be asking if Amazon is not as keen on using in-app ads as Wish, how come it got the top position in the App Store? Well… we know that Amazon has a very strong brand and is using its brand name keywords effectively on the ASO side. Yet, there is also one other paid user acquisition method that Amazon is great at using: Apple Search Ads.
Amazon’s Apple Search Ads Keywords
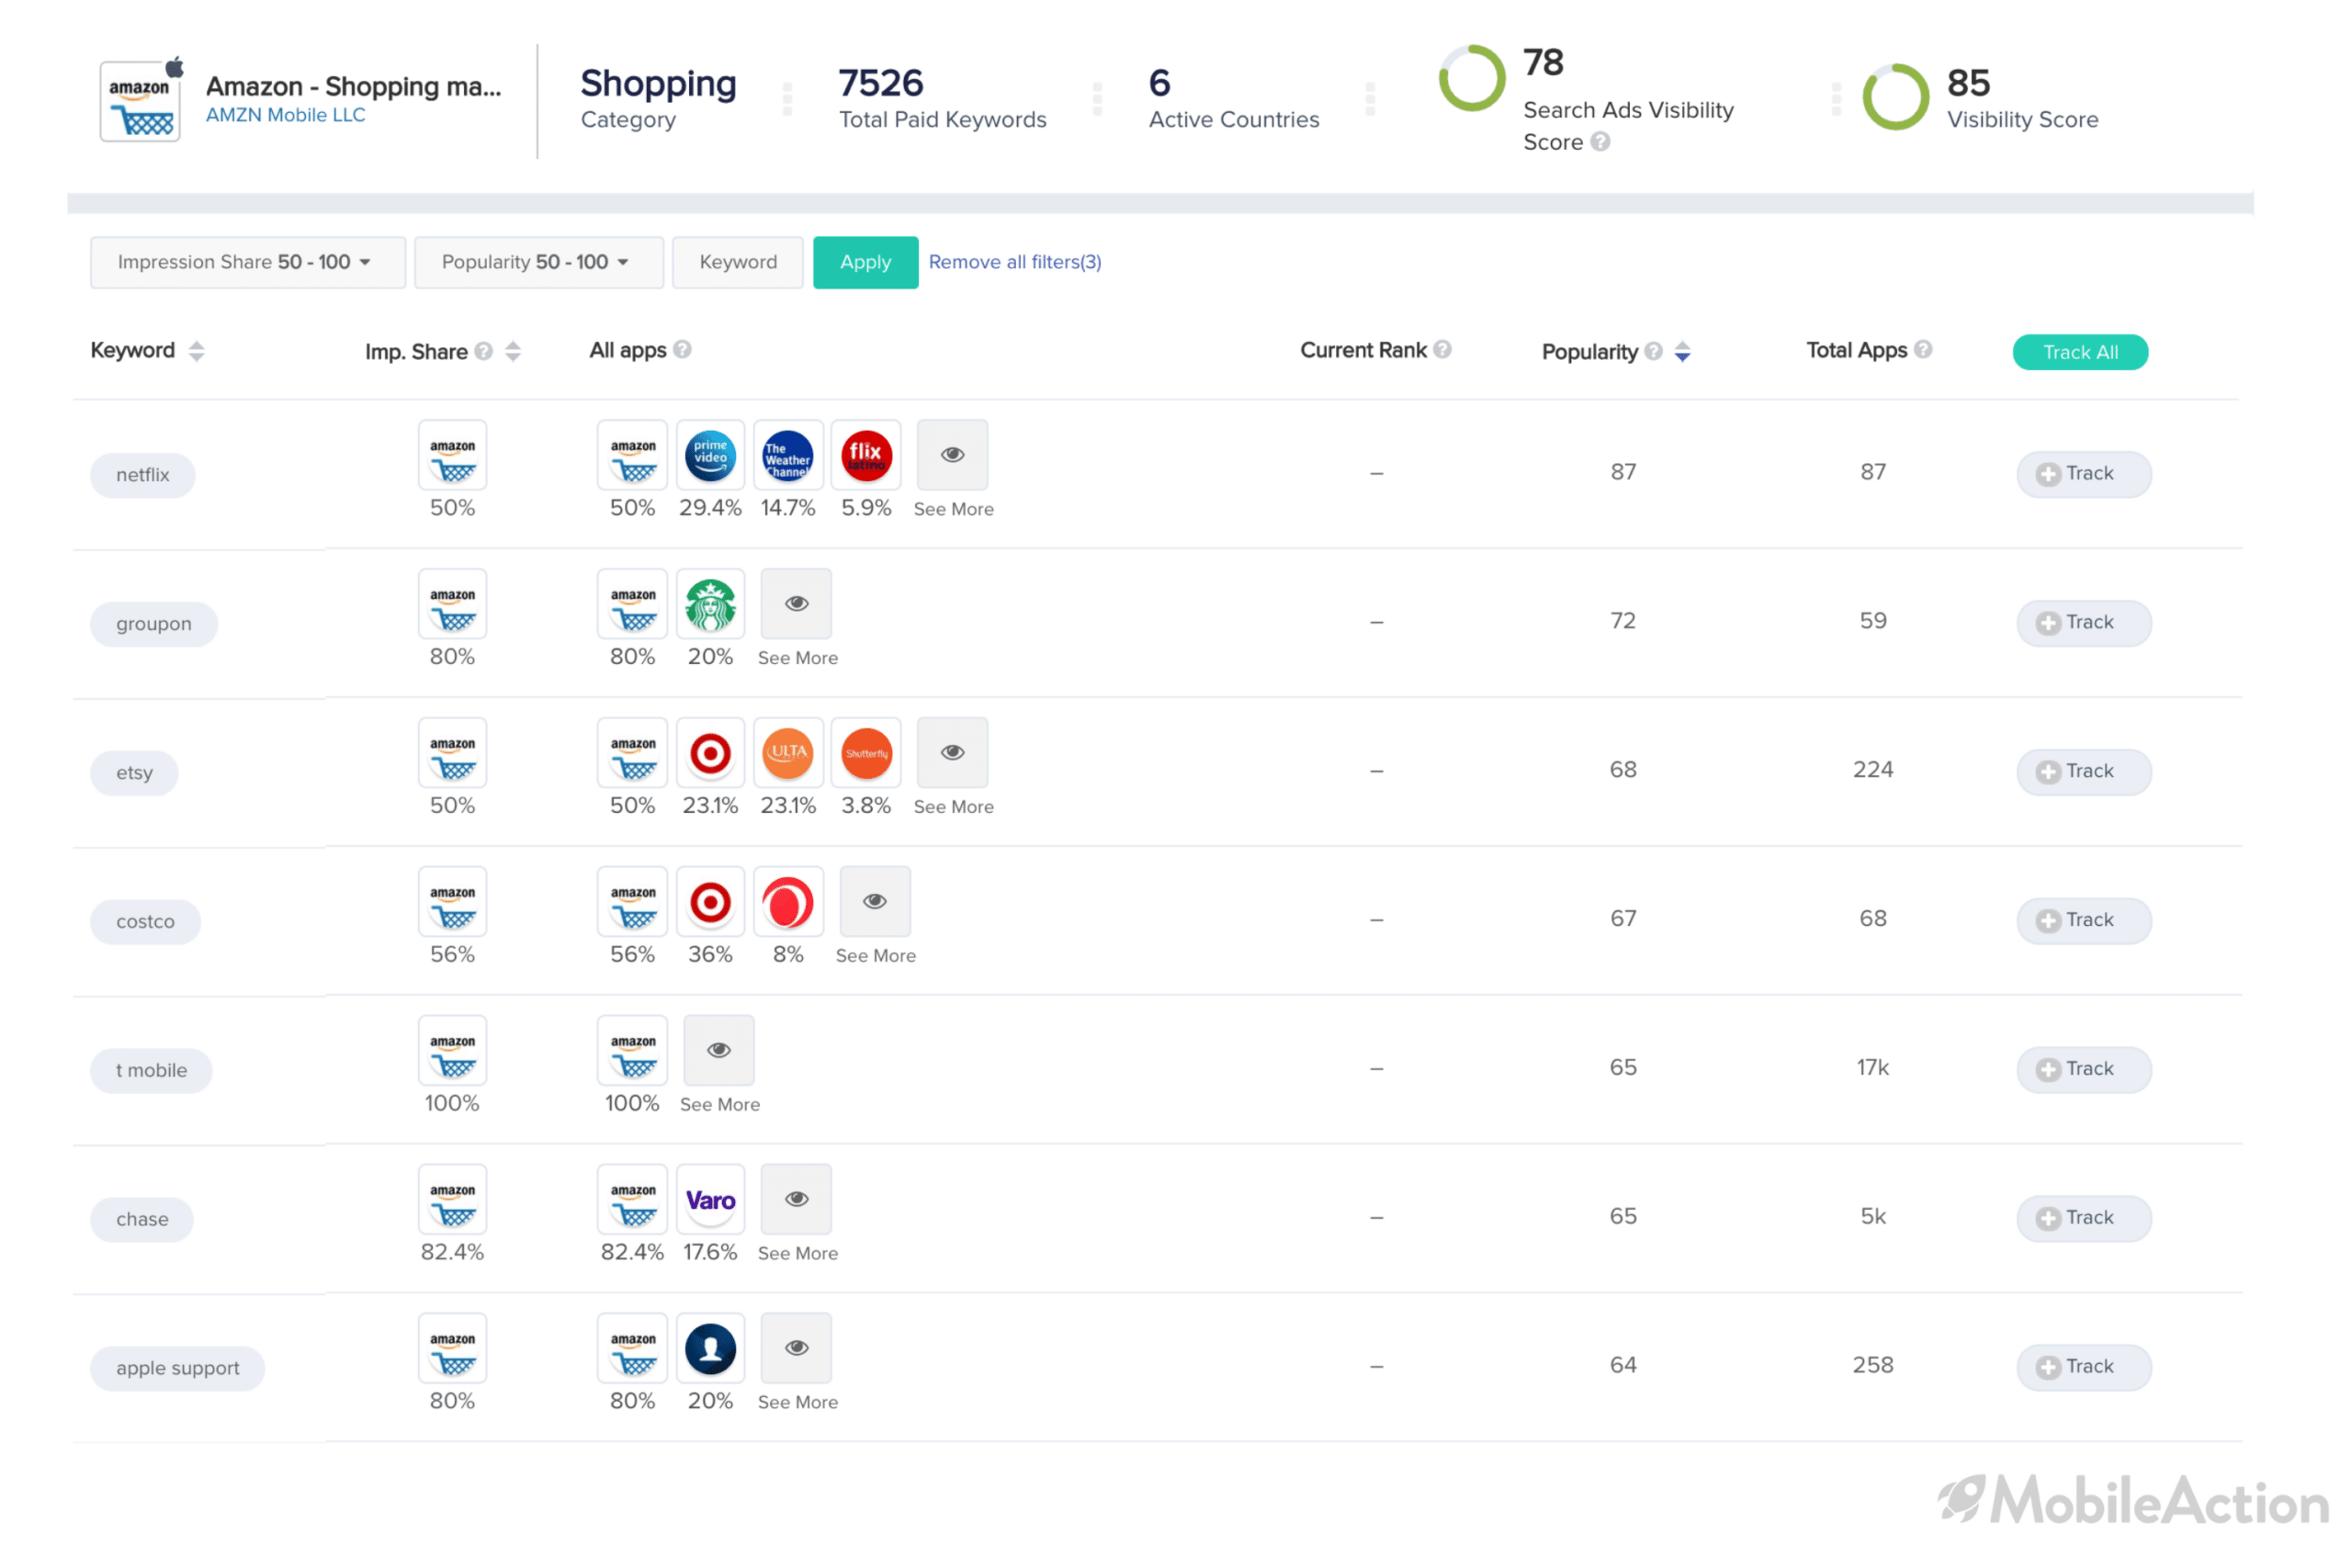
Amazon is running Apple Search Ads on 7,526 keywords in total, and overall, it has a great Search Ads Visibility Score in the US. We set the impression share and popularity filter to 50-100 to get the highly popular keywords from which it gets at least 50% of impression.
At the very top of the list is the keyword “netflix” with a 50% impression share. Now, Netflix is obviously not a direct competitor of Amazon. One is an entertainment app while the other is the king of the Shopping category. So why would Amazon bid for the brand keyword of Netflix?
One answer can be that Amazon is simply targeting a popular keyword to take advantage of the traffic. Another answer can be that it is simply targeting users who are looking to spend their leisure time, doing something enjoyable. When we think about the average free time people have per day (4 hours in most cases), we can say that an app such as Amazon is competing with Netflix to be a part of people’s free-time activities, which makes Netflix an indirect competitor 🙂
The interesting thing here is that Amazon seems to be getting the highest Search Ads impressions in the absence of Netflix. Well… Who knows… Maybe there was a time when you just wanted to watch something and were going for Netflix in the App Store, but then remembered that you need one of those brand new wireless headphones and wanted to check the price on Amazon. People’s thoughts keep wandering around, and sometimes, all marketers need to do is a light push 🙂
The Search Ads data about Amazon is sourced from our Search Ads Intelligence feature in ASO Intelligence product while the download estimations are from our Market Intelligence solution. In addition to download data, our users are able to see Revenue estimations, Daily Active Users (DAU), Monthly Active Users (MAU), and Audience Geography. We offer this data as a dashboard in our Market Intelligence Plan.
Interested in learning more or the data we can offer? Schedule a demo with us!
