
Products
Newsletter

Subscribe to never miss an update in mobile app marketing.

Login
Get Started
Book a Demo

Discover winning formulas with ad analysis

Identify the champions of the paid user acquisition ecosystem, whether it's apps, ad publishers, creatives, or app developers, to understand the keys to success.

Trusted by 5,000+ mobile app and game companies around the world

spotify logo starbucks logo crypto.com logo square logo grammarly logo calm logo priceline logo paramount logo zalando logo dream logo productmadness logo fox logo wolt logo creditcarma logo
Keep tabs on the top advertisers
Top Advertisers
Keep tabs on the top advertisers
  • Analyze advertiser profiles
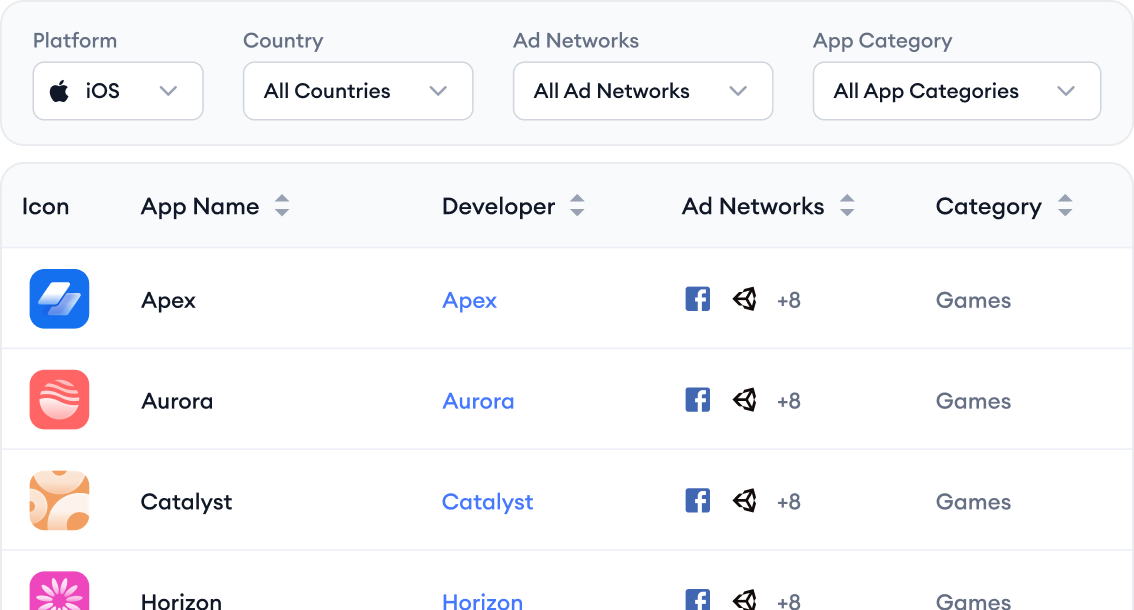
    Explore app profiles in detail including ad networks, countries, categories, and platforms data to get a holistic view of the top guns’ paid activities.
  • Overview top apps’ ad spend
    Discover spending behaviors, impression scores, and preferred platforms of top apps and figure out how and where you should invest more.
  • Uncover competitive creatives
    Analyze the number of unique ad creatives and ad networks used by top advertisers and tweak your own approach.
Start Now
Track the leading ad publishers
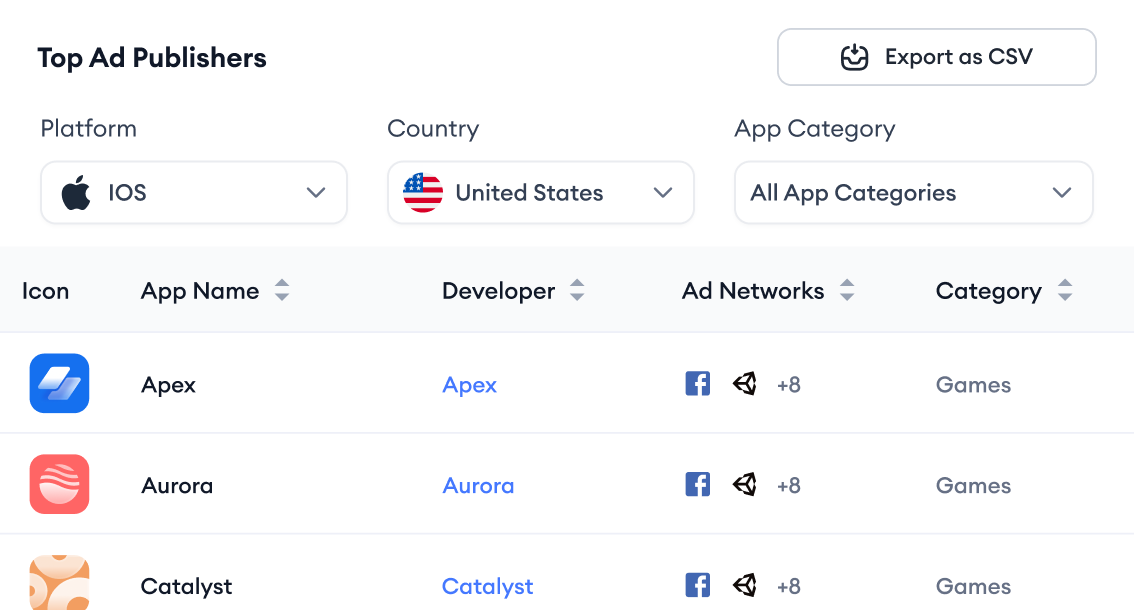
Top Ad Publishers
Track the leading ad publishers
  • Check the ad publishing density
    Spot the apps with the highest ad frequency across diverse categories and use the knowledge of their ad distribution strategies to refine your own placements.
  • Competitive app landscape
    Understand the preferred apps and ad networks heavily utilized for ad placement to increase app visibility and use this info for building targeted, cost-effective ads.
Start Now
Watch the top-performing creatives
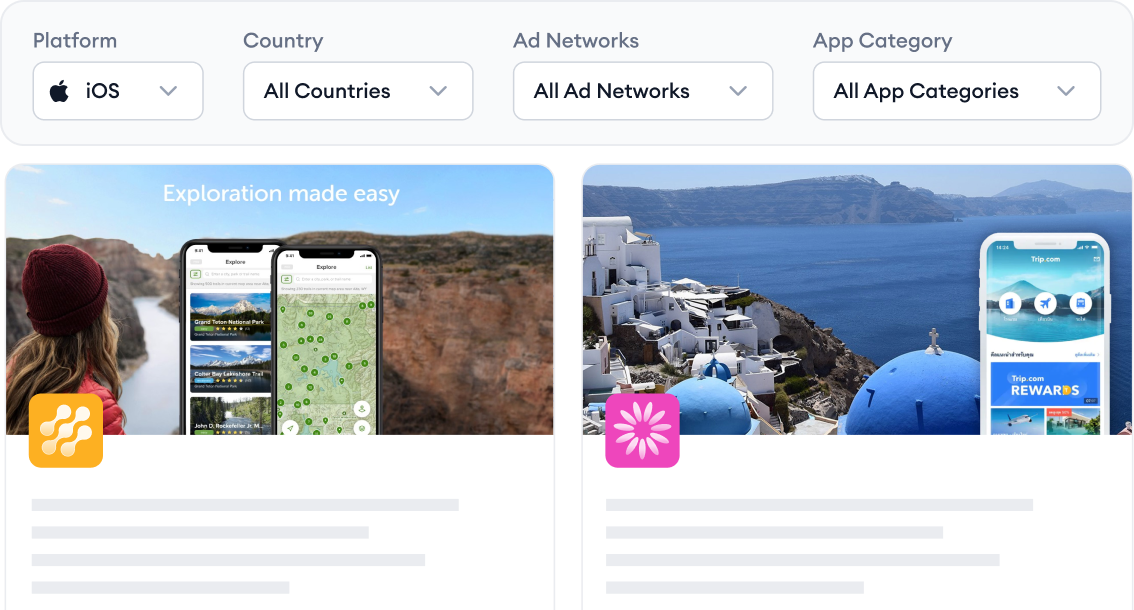
Top Creatives
Watch the top-performing creatives
  • Ad creative performance evaluation
    Analyze the effectiveness of ad creatives with detailed analytics, adjust yours accordingly and improve paid performance.
  • Customized ad creative research
    Browse mobile ad examples across formats and networks, fine-tune with advanced filters, and craft segments that match your marketing objectives, a working library of ad examples for every brief.
  • Impression distribution analysis
    Discover the impression distribution for researched ads, find differentiator creative elements and optimize your ad creatives to capture a larger portion of ad impressions.
Start Now
Monitor the success of certain developers
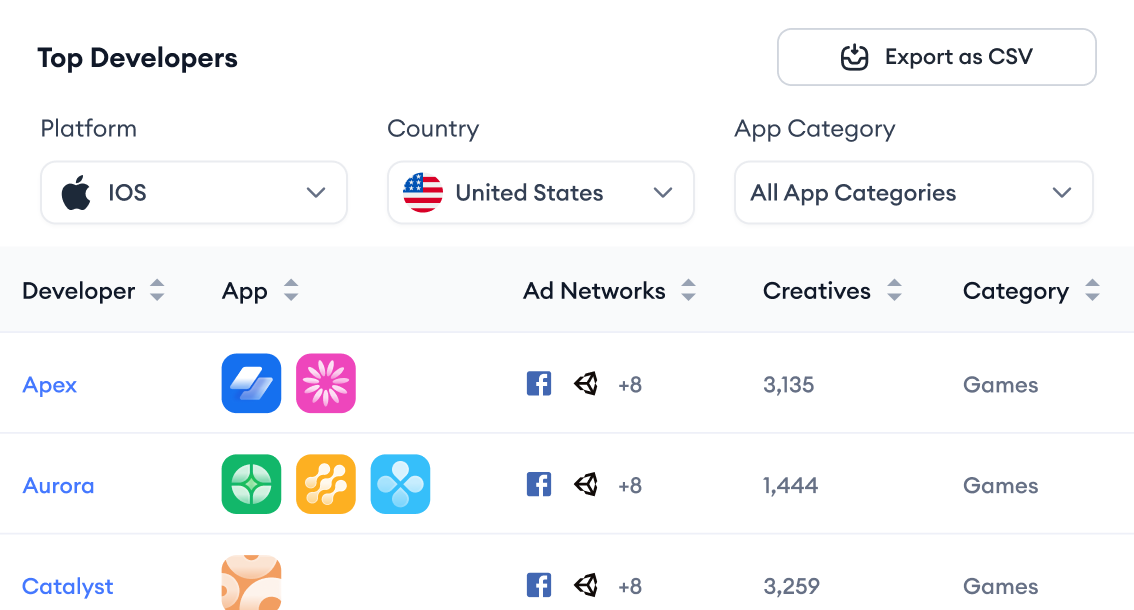
Top Developers
Monitor the success of certain developers
  • Developer visibility analysis
    Benchmark against competitors and evaluate your position among developers and plan your next move to stand out.
  • Snapshot of any developer’s performance
    Explore your competitors' app portfolio, ad network preferences, creative statistics, and advertising strategies.
  • Customized filtering options
    Tailor your analysis by filtering developers based on categories, ad networks, countries, and time ranges, refining your competitive assessment for targeted insights.
Start Now

Frequently asked questions

How do I find ad examples in my category?
Filter the creative pool by category, format, network, and country, and the top performers surface with their impression data attached. Thousands of apps run ads that nobody engages with, so a gallery of ad examples alone teaches very little. Impression data is what separates the creatives your category actually rewards from the ones that just exist, and sorting by it turns browsing into research.
Who are the top advertisers in my category?
In the MobileAction platform, open Top Advertisers and filter by your category, country, and platform. The apps investing most heavily in paid UA line up with their ad networks, creative counts, and spend behavior attached. From there, click into any advertiser's profile to see which networks carry their ads and how many unique creatives they rotate, and use Top Creatives alongside it to see the actual ads earning those impressions. Checking the list monthly shows you when a new player starts spending, which is usually worth knowing before their ads show up next to yours.
Where do competitors' ads actually run?
Publisher data answers it: which apps carry the category's ads, how dense the placements are, and which networks connect them. Knowing where inventory concentrates turns media planning from habit into evidence.

Hear from our customers

“MobileAction has transformed our approach to ASO and Apple Ads. The ease of discovering new keywords, along with insights from their competitor research tools, has enhanced our visibility and scalability. The personalized support has made complex data analysis both accessible and actionable for our team. We’ve observed a 41% increase in the number of ranked keywords.”
George Perevoznikov
George Perevoznikov
User Acquisition Manager
Read the Full Success Story
“MobileAction’s Ad Intelligence helped us refine our ad strategy and increase ad CTR by 200%”
“The MobileAction platform has been very practical to our marketing efforts at Lyrebird Studio. I highly recommend it to any app marketer seeking to refine their strategies and gain actionable insights into competitor performance and market trends.”
Metehan Kanbur
Metehan Kanbur
Creative Team Lead
Read the Full Success Story
“The impact of MobileAction on our team is undeniable, leading to a positive shift in how we allocate our time. MobileAction has made our creative efforts more flexible, strategic, and in tune with the dynamic needs of our industry. They are more than an optimization tool for us, but they have become a guide that helps us be more responsive and innovative in developing our projects.”
Christina Borm
Christina Borm
Growth Marketer
Read the Full Success Story