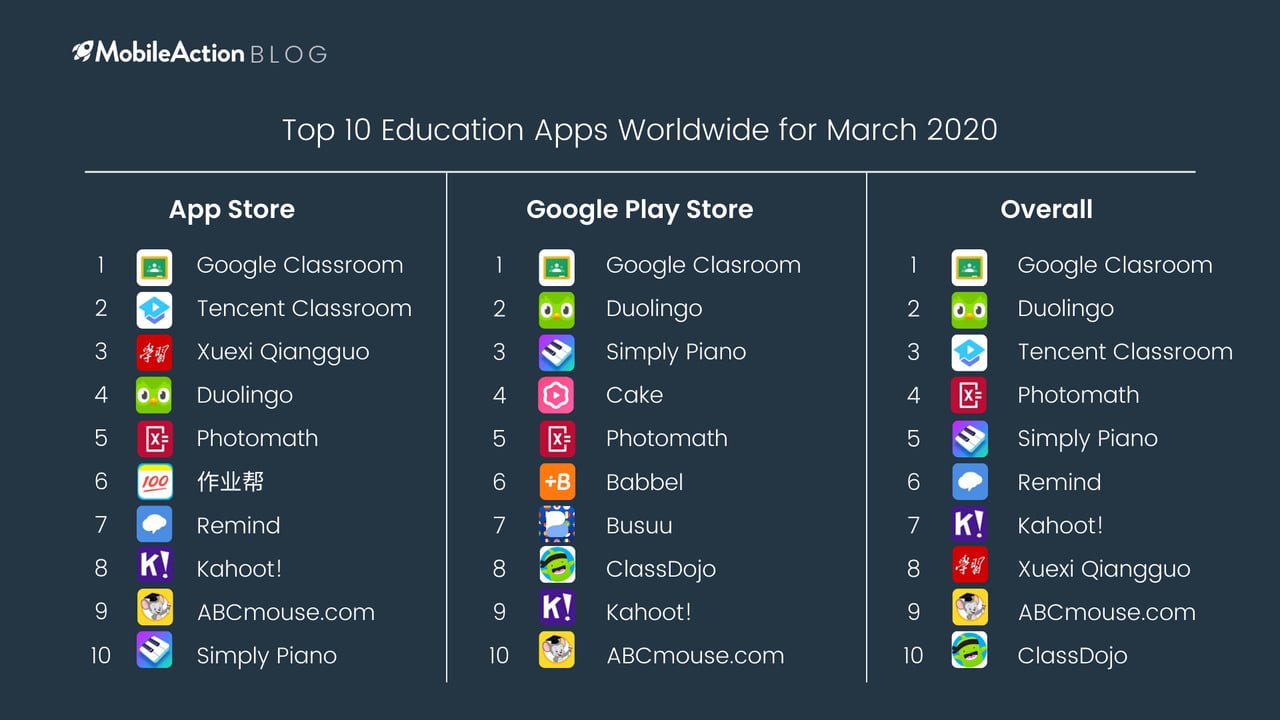
The above chart shows the Top 10 Education Apps Worldwide in March 2020 for the App Store, Google Play Store, and both stores combined. The apps are sorted based on their download numbers. In both the App Store and Google Play Store, Google Classroom was crowned as the Top App. This doesn’t really come as a surprise as it might have been popular throughout the public schools already and was made use of during the pandemic. As we all suspected, with the spread of coronavirus some apps have gotten affected more than others. Education must continue so online education has become the new normal. So, apps under the education category can be seen as one of the fortunate ones as they’ve been affected positively by the situation.
Monthly Active Users of Google Classroom
Google Classroom is a known app and especially in the month of March where some states have shut down schools temporarily Google Classroom’s Monthly Active Users seems to have been affected positively, showing a rise.

As we can see from the graph there’s a significant increase throughout the month of March, for iOS. We also see that Google Classroom is the first in its category ranking. A 15% rise in its monthly active users for the USA can also be seen above.
Audience Geography of Google Classroom
Google Classroom’s audience geography shows some differences with Google Play Store and the App Store. However, for both stores, it seems to be used in a number of different countries.
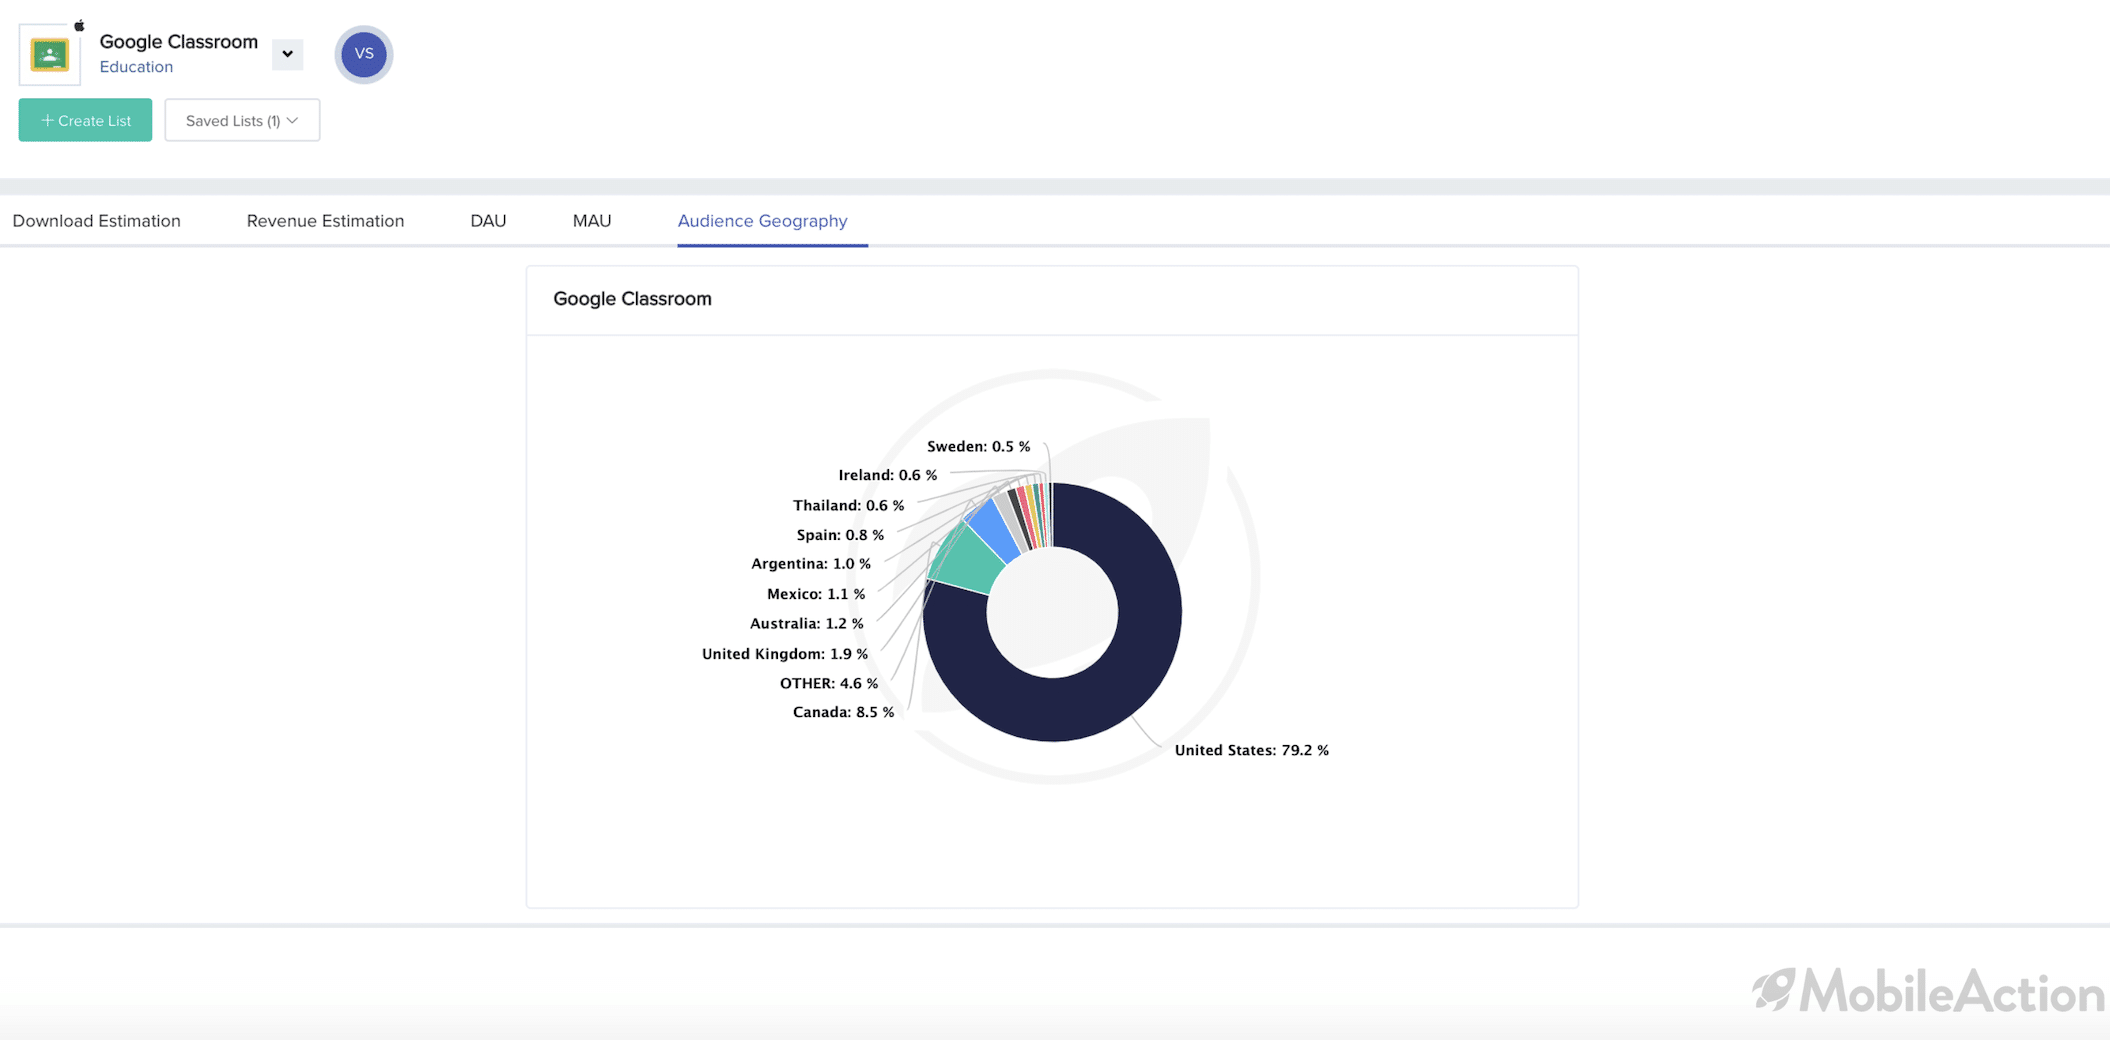
When we look at Google Classroom’s Audience Geography for iOS, we see that it’s more popular in the USA and Canada, this might just be due to Apple’s popularity in North America. It makes up more than 85% of its users.

Over on the Google Play Store, the USA and Canada, however, make up only about 21% of the users and the distribution through different countries seems to be more apparent. For Google Play Store, Google Classroom seems to be getting most of its users from Brazil with a 37%.
Campaign Analysis of Duolingo
Let’s also take a look at how Duolingo, who got crowned second place. Duolingo is the second most downloaded education app of Google Play Store. But because it has a very high download estimate from the Google Play store alone, and still a high download number from the App Store it came in second in Overall too, following Google Classroom. It is still in the education category but it is strictly a language learning app, so it might give us a few clues about Ad strategies to analyze it.
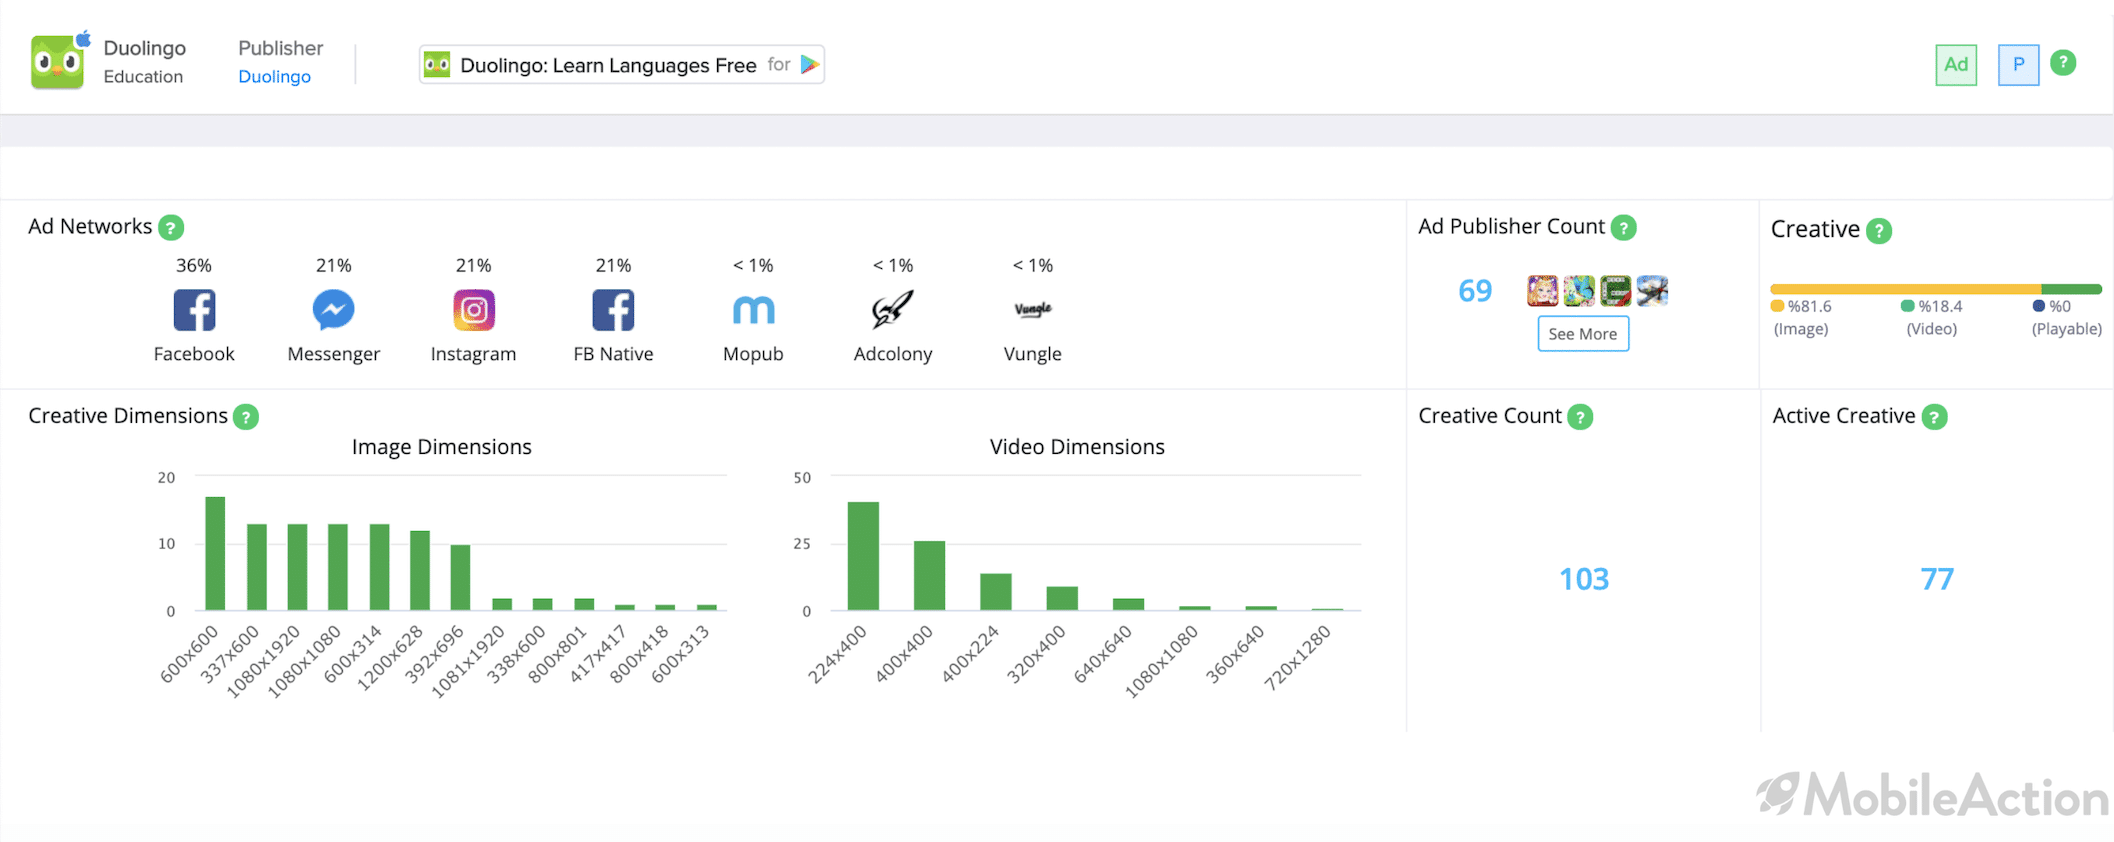
Duolingo is both running ads and publishing ads. And the ad networks it uses can also be seen above, it uses Facebook and Instagram as its main ad networks, about 99% total. In addition to this data we can also see how many active creatives it has and the ad publishers.

When we click over to see the details of its ad publishers we can see what kind of apps they prefer to run their ads in and it seems to mostly game apps for iOS.
However, we see a more colorful graph in Google Play Store, hence why they might have been crowned second place here.
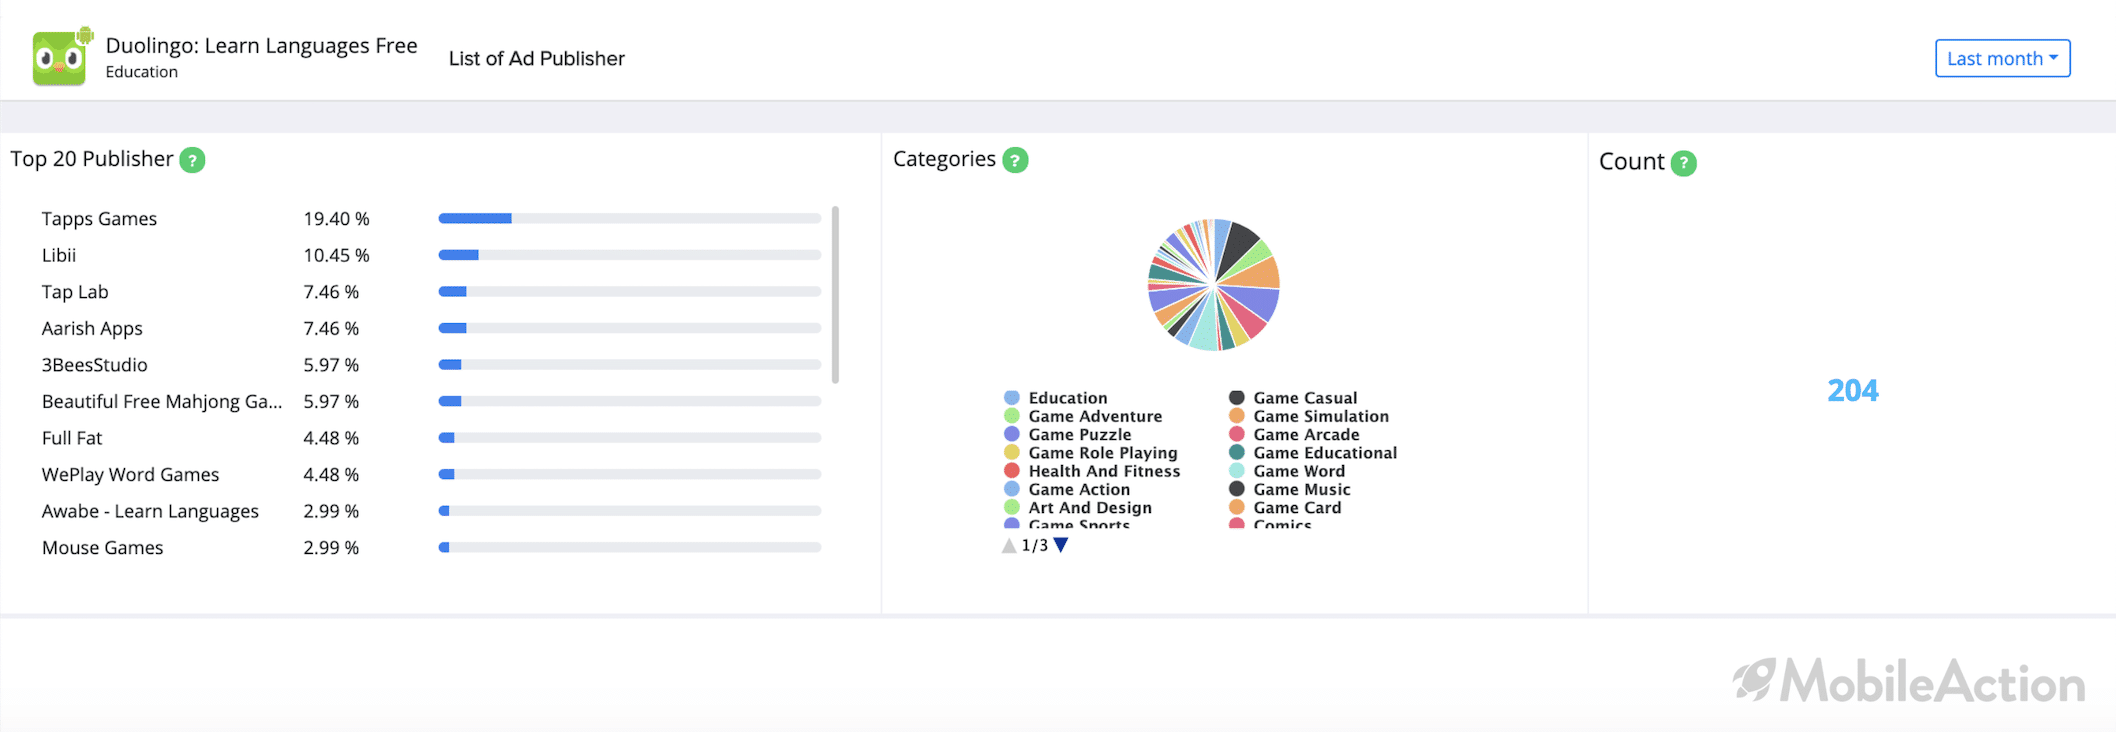
It’s as publisher count for Google Play Store is higher and we see that it has given a big piece of the pie to education along with various game categories.
Visibility Analysis of Duolingo
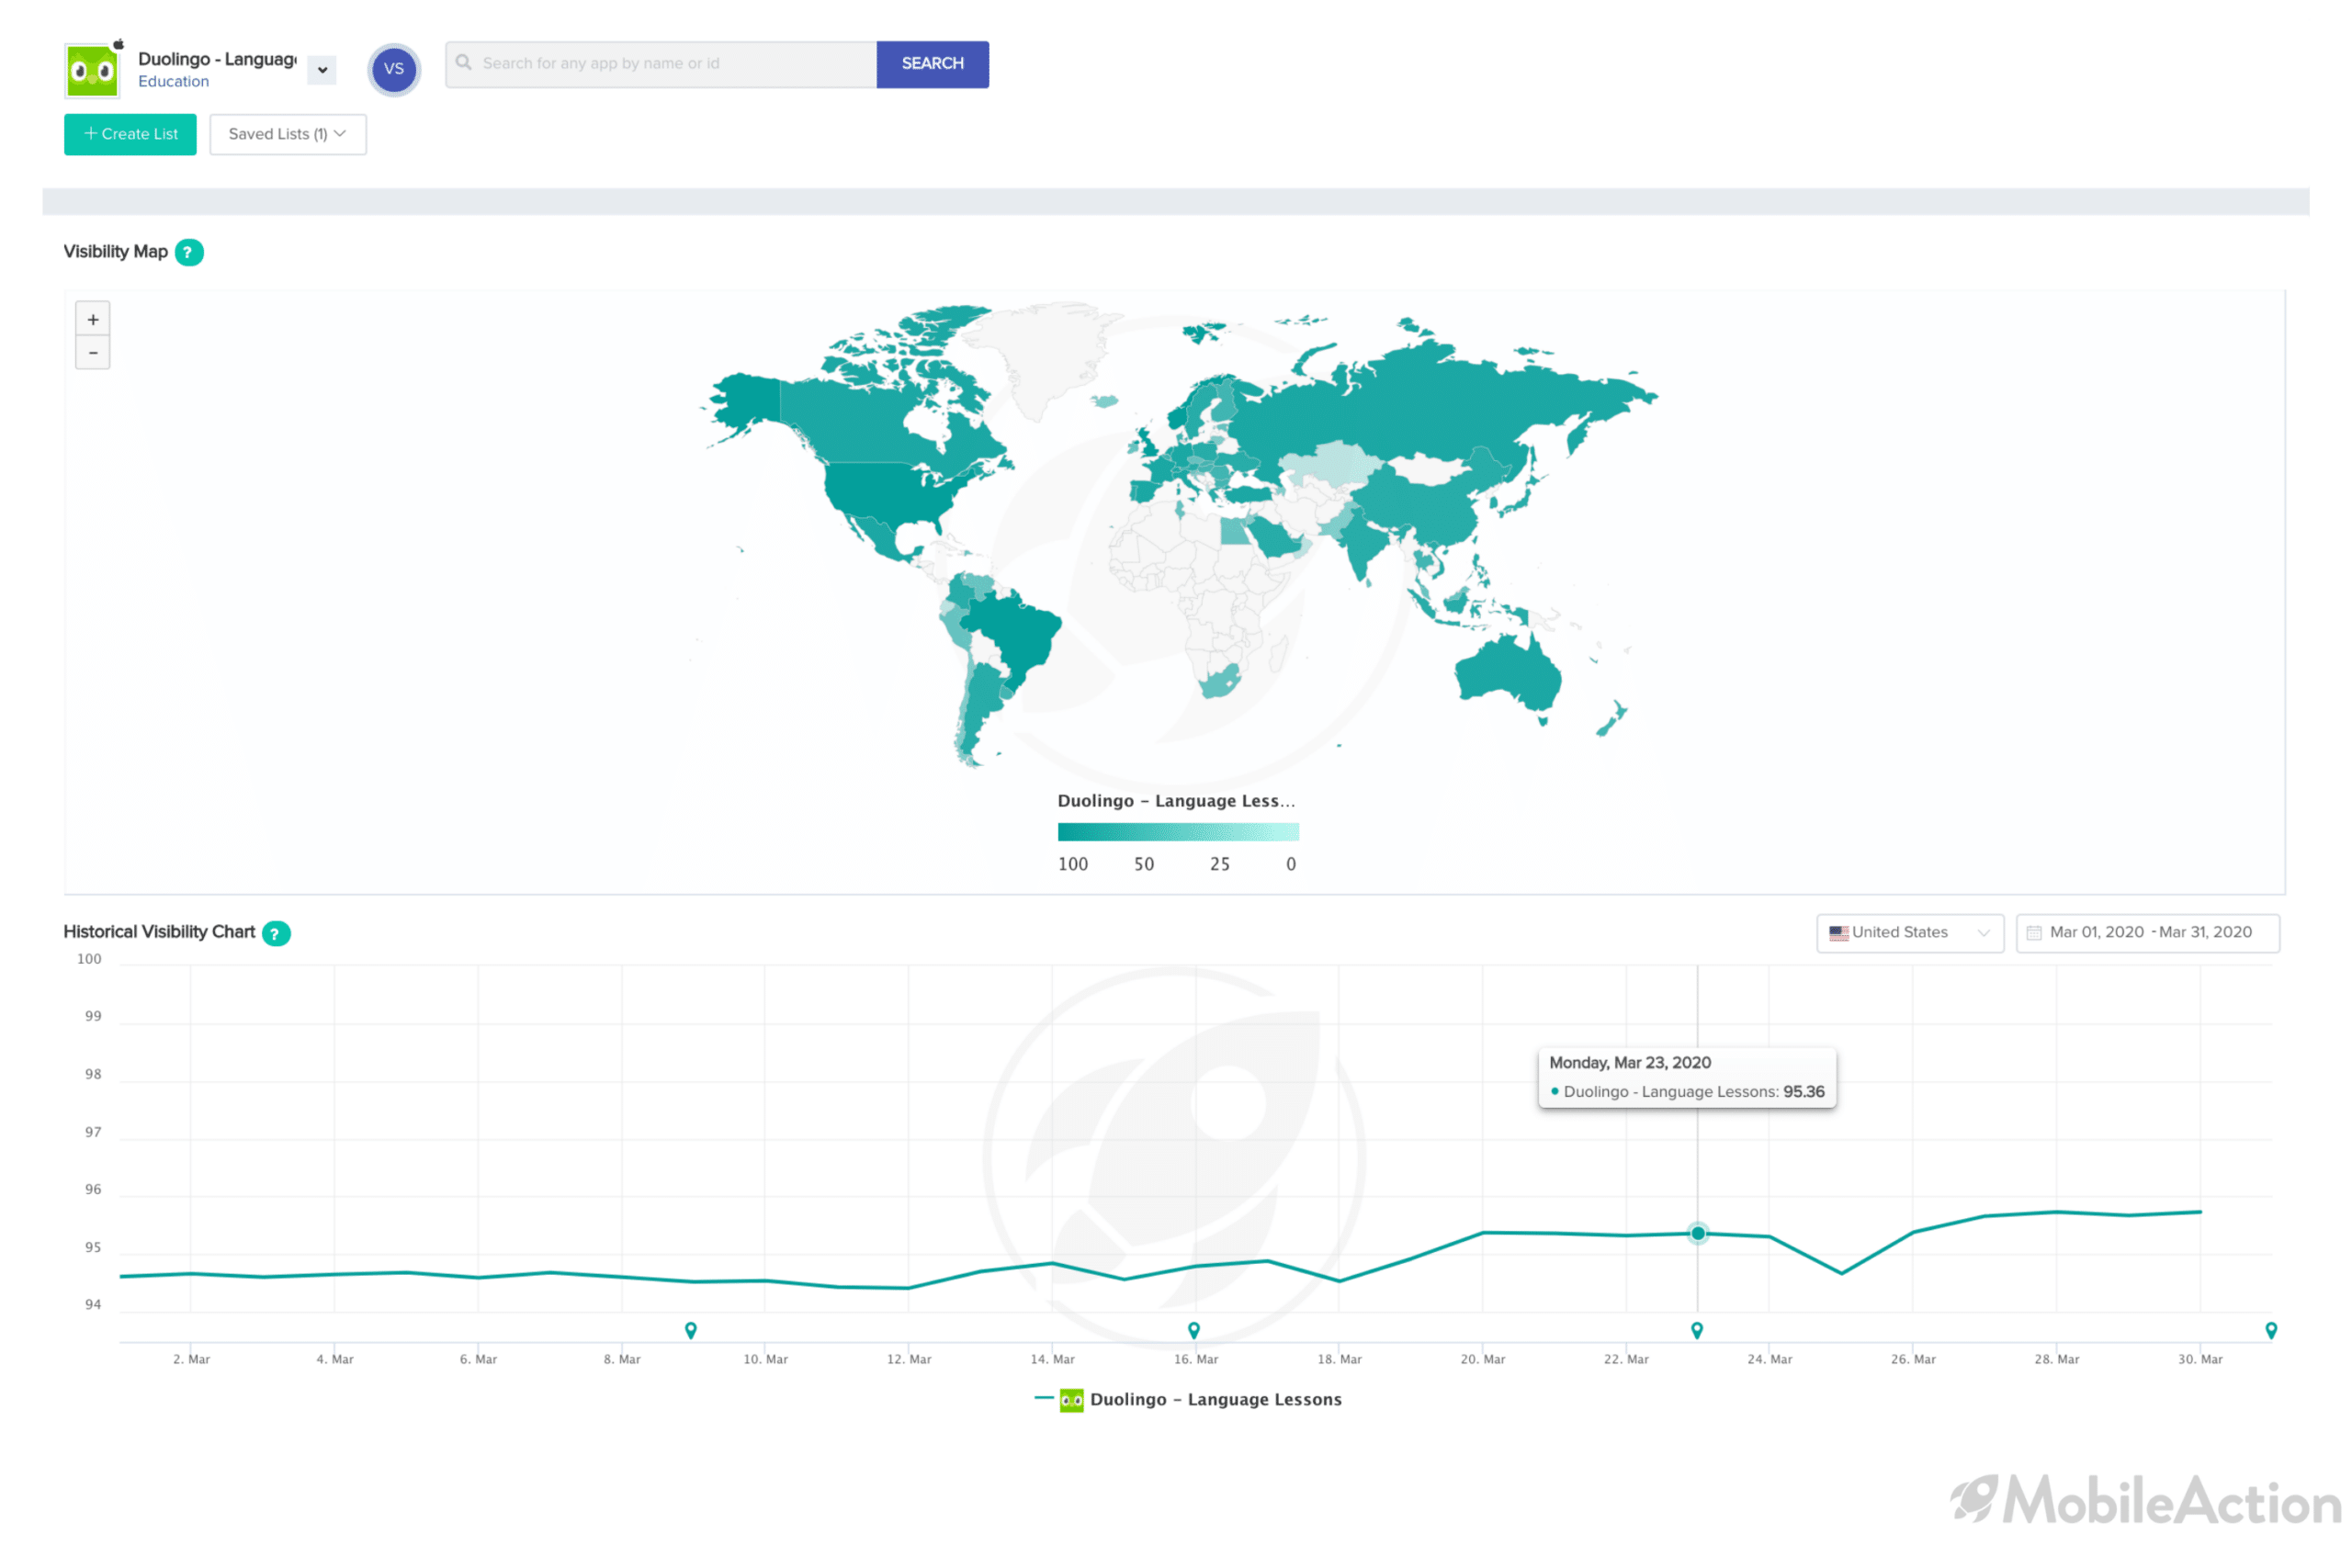
As we can see from our new Visibility Report feature’s Visibility Map, Duolingo seems to be visible in a wide range of different countries. When we look at the data for the USA, we see that it had updates 4 times throughout the month of March and that it’s visibility score has increased by the end of March.
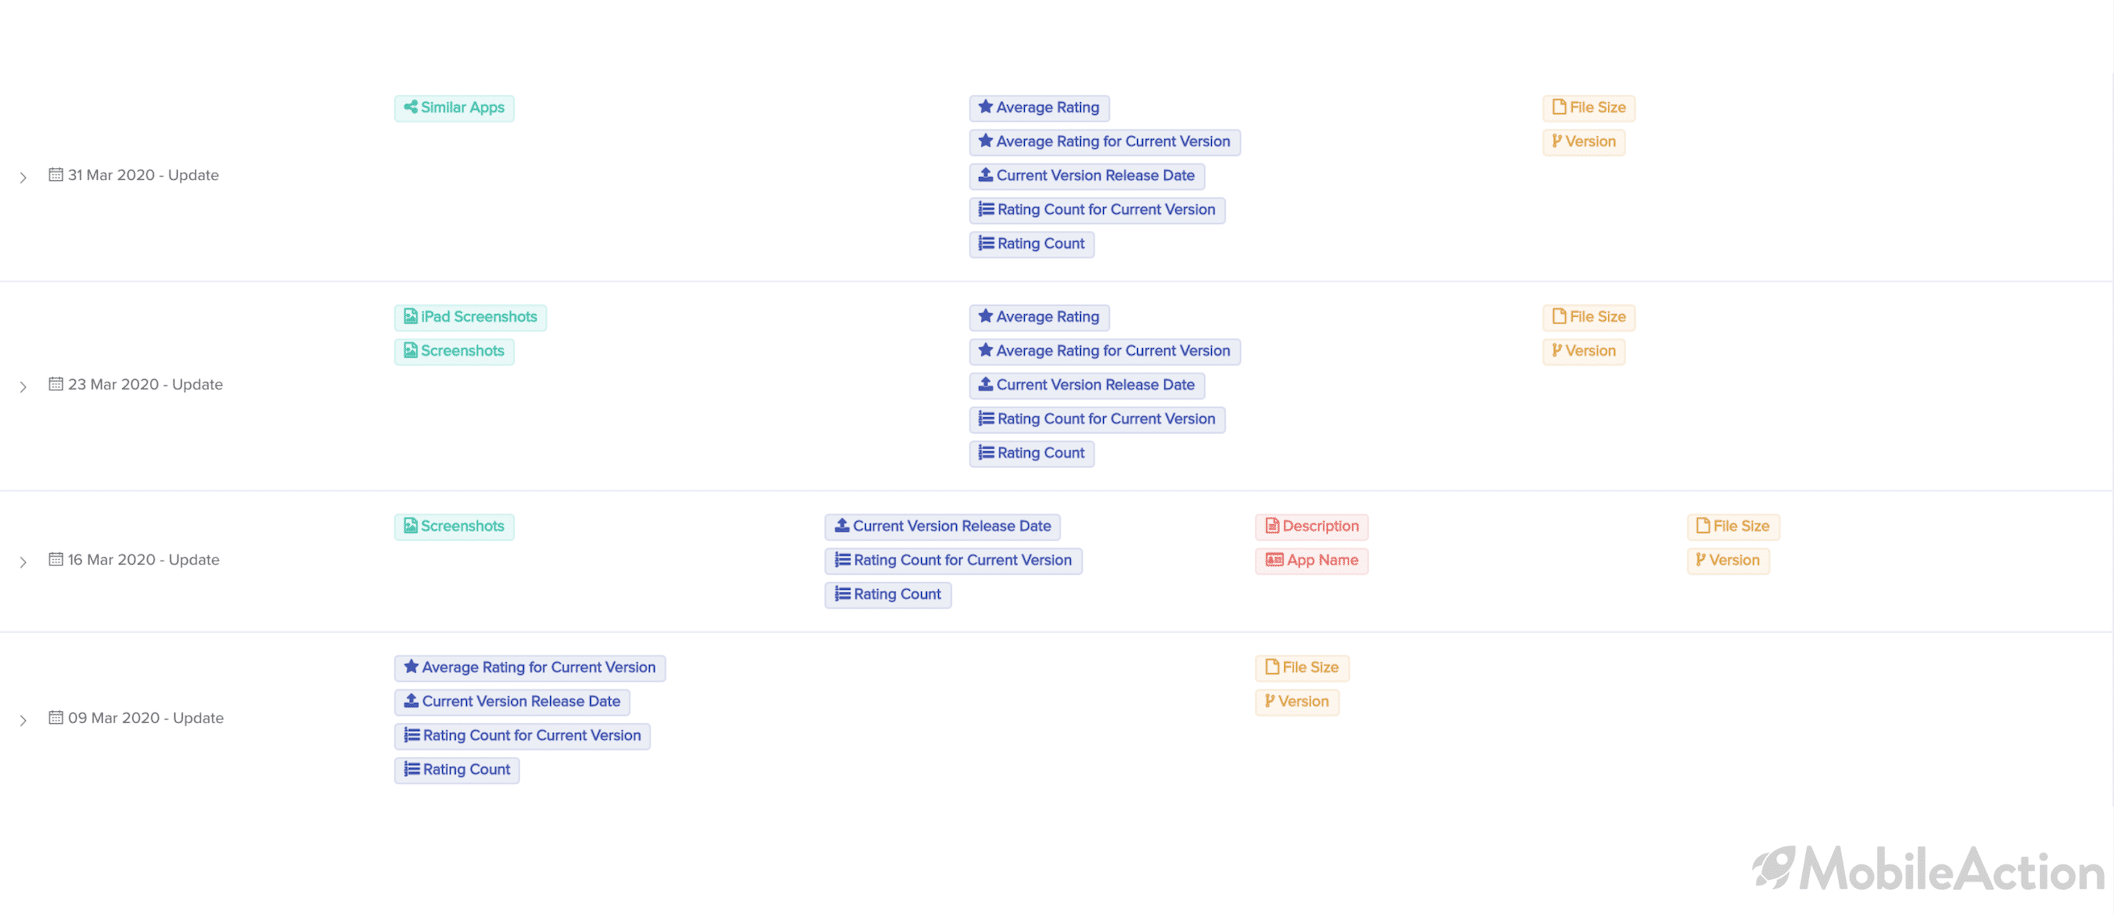
If we hover over to one of these dates we can see the details of updates. For example, they seem to have revised numerous things, including screenshots, description and even changed their app name from Duolingo to Duolingo – Language Lessons.

Keeping your app updated and new is always a good way to experiment to see whether or not it does anything towards acquiring users. Duolingo is a popular app but it has done numerous updates to keep it fresh as we have seen from the data we provided.
The download data is sourced from our ASO, Ad Intelligence and Market Intelligence products. Our users are able to see Revenue estimations, Daily Active Users (DAU), Monthly Active Users (MAU), and Audience Geography. We offer this data as a dashboard in our Market Intelligence Plan.
Interested in learning more or the data we can offer? Schedule a demo with us!
