To be able to come up with a solid ASO strategy and grow organically in the competitive app marketing world, having access to data is crucial. Within the metadata, a throughout ASO strategy analysis plays an especially important role in organic growth strategies. All app firms looking to analyze their and their competitors’ strategies; should be looking into what kind of keywords have worked and what hasn’t. No matter how big or small. In fact, at the core of the ASO and ASO Report page is the detailed analysis of keywords. If you think about it; no app firm would be able to analyze all of their keywords with ease. There are tons of keywords to do such analysis.
Here, we have a quick and cost-effective (which is indeed magic) solution for anyone doing ASO: ASO Report page. With it, you will be able to access almost all of the data you need on just a single page.
Through the capabilities we provide within the revamped ASO Report, you will be able to come up with a detailed ASO Report to present to your higher-ups. Not only that but, you can make ready an even more detailed report in a short period of time. The most critical thing here is to know what you’re looking for and how you want to filter. And the rest? We take care of that.
Now let’s go over our revamped ASO Report page to uncover all its capabilities together. We’ll be doing our analysis with House Life 3D; by Good Job Games for this post. They were number 3 in iOS, in our Top 10 Games for the September list.
Let’s look at the screenshot below to give you a rough idea of how the first half of the ASO Report Page looks.
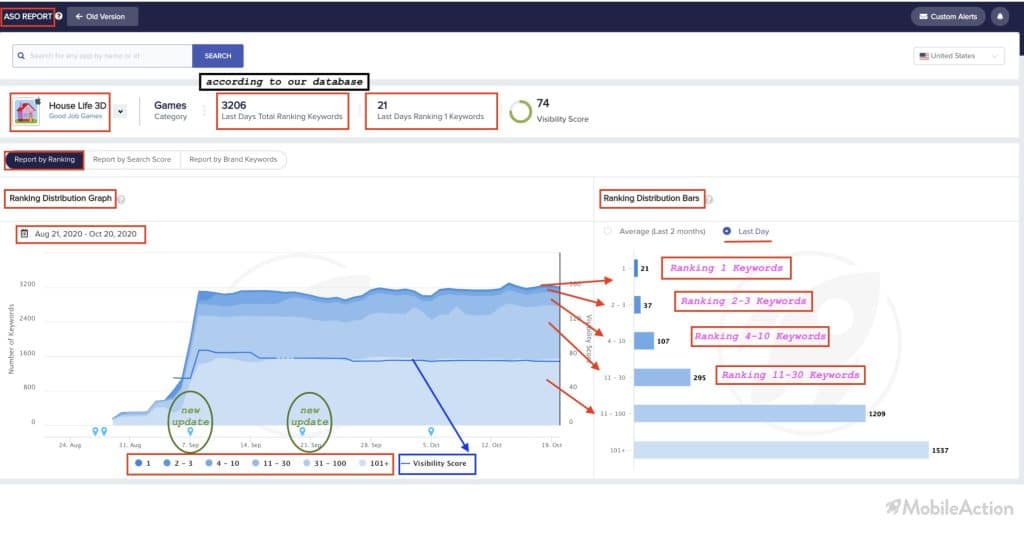
Here you can easily get an overview of the performance of House Life 3D over the keywords. As you can see above House Life 3D has 3206 keywords that its ranking for. Within these keywords, you can see how many of them have a ranking of 1, 2-3, and so on for the selected country and dates. This tool allows you to keep track of top keywords out of the hundreds you rank in daily.
In this revamped version of the ASO Report; you can see the performance of all your keywords (such as volume, chance, and apps they appear in). Whereas with the old version you provided up to 100 of your keywords no matter the total number of keywords you had. Now we have expanded the data. So that there’s no limit to the number of keywords you can see the performances of. And they load faster than ever too.
Likewise, in the older version, the users were provided only with the keyword rankings and their performances in the given timeframe. Which was the last 4 days. But now with the revamped version, you are able to see up to 8 weeks of data. We’re planning to give up to 1 year in the near future as we collect more and healthier data by the day.
To make it more clear, an example might work better. Let’s say you chose a new keyword for your app “girl games”. The app store takes this keyword and shows your app on top of that new keyword’s searches (for a while, to see whether it’s a relevant one for your app or not).
If you get no downloads from this keyword, the App Store drops your ranking for this keyword. And if you do get a lot of downloads, it rewards you by making you more visible for that keyword. So, a keyword finding its stable place takes some time.
When you update your app with new keywords, a 4-day life span can only get you a rough idea and is not enough to decide whether or not they work well or not. This time frame is not stable enough to make you keep or ditch your new keyword. With the old version 4-days gave our users a good idea about how a keywords performance was. Now with the extended 8 weeks, users can capture a keyword’s performance much more accurately.
As any experienced ASO Practitioner would argue, an acceptable time for trial and error is at least 4 weeks per keyword. And for an even healthier check, this period should go up to at least 8 weeks. Increasing the time frame from 4 days to 8 weeks is a big jump that we hope to increase even higher as we get more data each passing day.
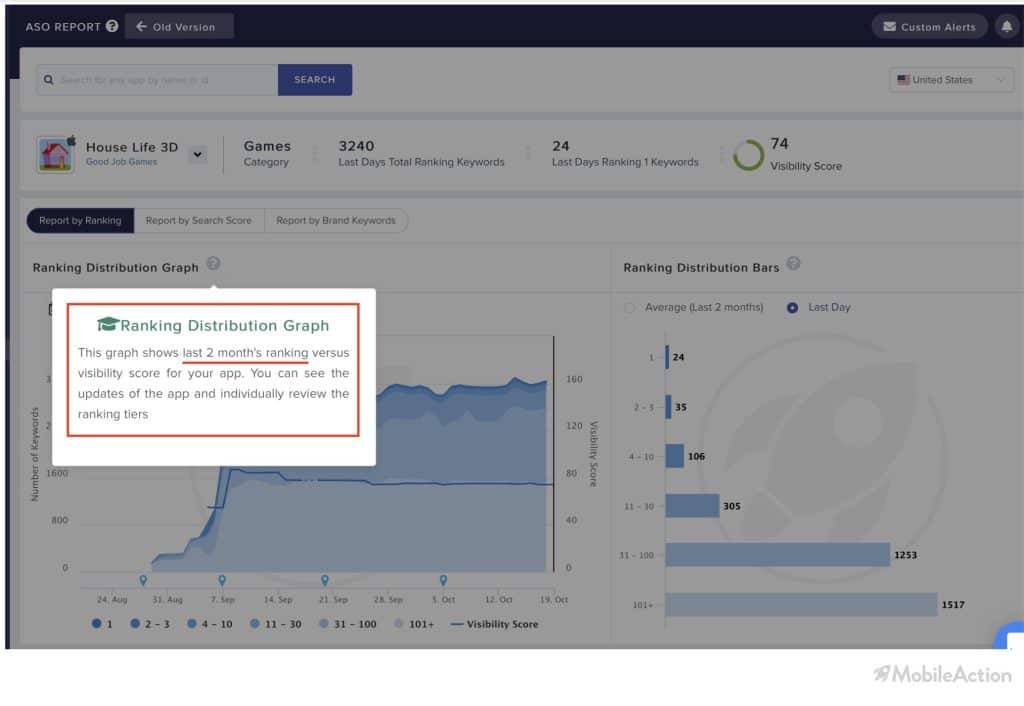
You can now see for the past two months which of your keywords have been ranking number 1 or 2-3 and so on, on one page with a single gaze. Within these graphs, you can also see visibility scores over time, at the same time 🙂 To the graphs’ right, in ranking distribution bars, you can see the last day performance or, see the sum of the past 2 months with a single click. In other words, this table gives you the report of which keywords you’ve ranked 1, 2-3, and so forth for the past 2 months period.
Strong and Handy Data for Clever Analysis
ASO Consultants, managers or agencies now have the ability to play with the keywords data and perform deeper analysis for their apps and companies. Let’s explain what you can do with the new ASO Report Page.
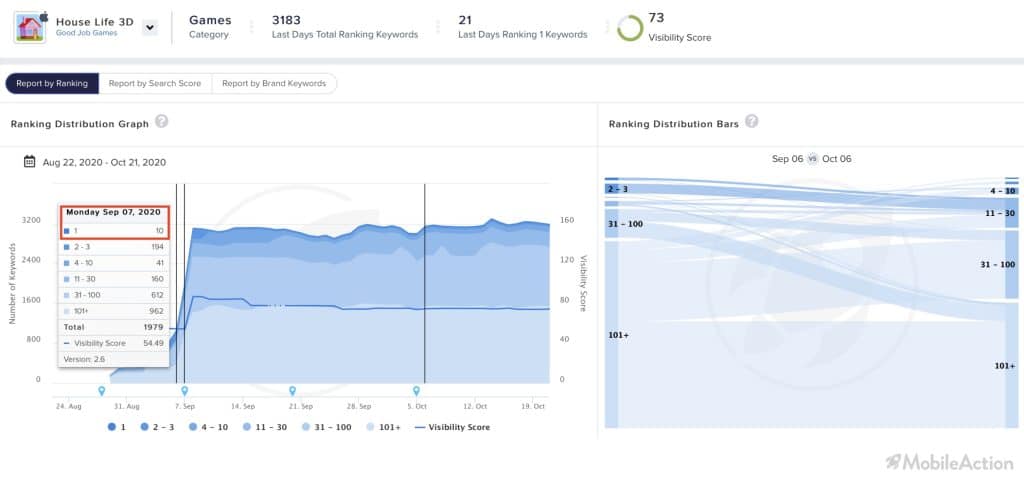
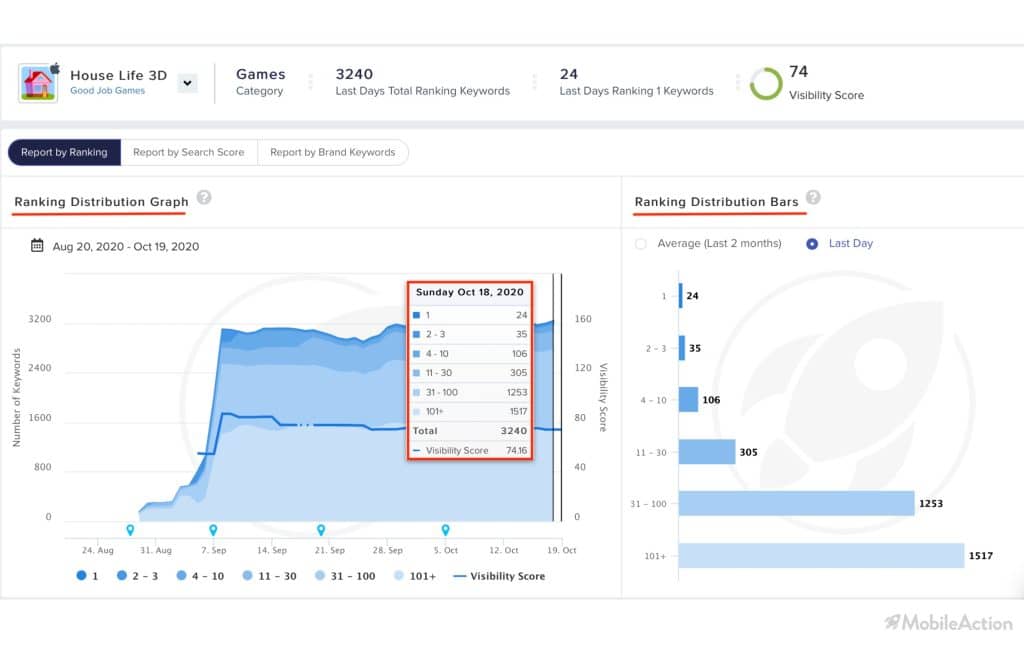
The screenshot above shows House Life 3D’s keyword performances between September 6th and October 6th. Just before the update on September 7th, ranking at 1st keywords are 10, and at 2-3 are 194 keywords (you can also see the keywords for other rankings).
When we look at the numbers on September 8th, we can see that the number of keywords that rank on number 1 reached up to 20. And those ranking at 2-3 have reached a total of 205. Also, their visibility has seemed to go up from 54 to 87.
This jump in their visibility and higher rankings in so many keywords might have happened because of multiple reasons. One being the changes they’ve done to their keywords list with one of their updates. From here on out we hand this over to the experts, to have fun with this deep analysis.
Again, on the screenshot above, over on the graph on the right-hand side clicking on the lines between the ranking numbers, will automatically activate the analysis tools below the graphs, which eases users’ pain.
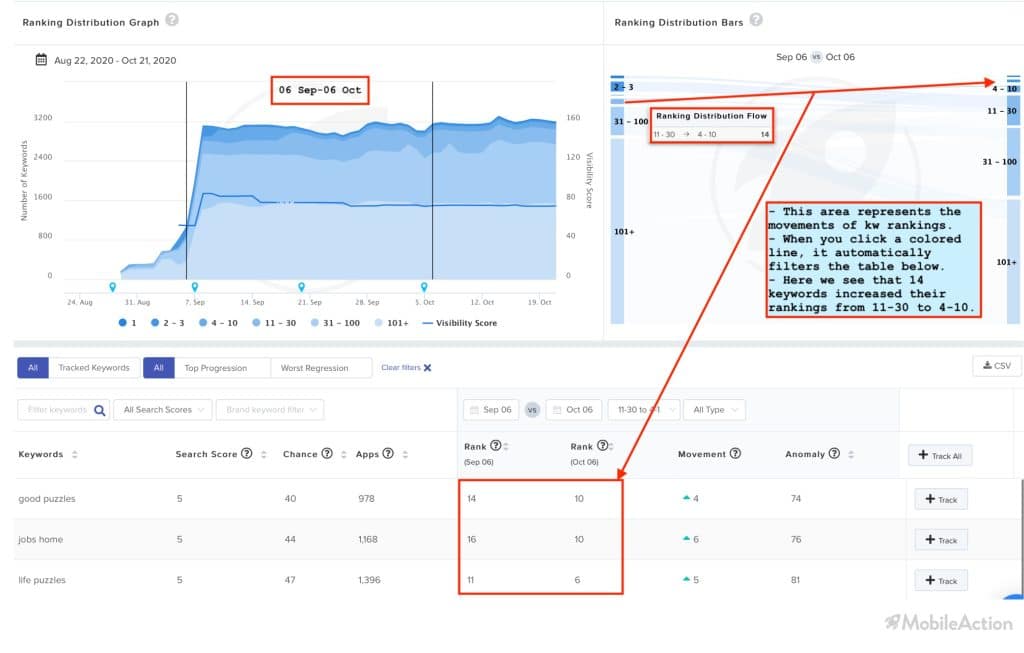
While a really detailed analysis is possible with this tool, a simpler one is also possible. When you go over to the Ranking Distribution Flow and click on the blue-colored bars, (which represent the rankings) it will automatically give you a filtered view of the data. Like in the screenshot above.
Let’s try to evaluate the figures on the screenshot below together.
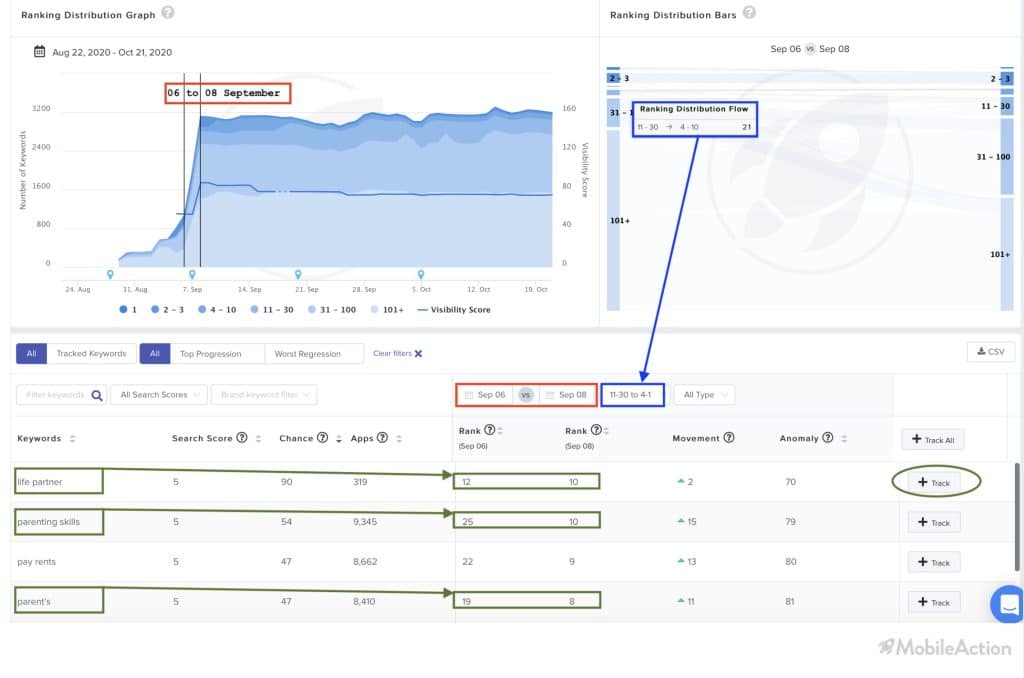
Here, from September 6th to September 8th (probably linked to the update on the 7th) 21 keywords seem to have increased their rankings from 11-30 tier to 4-10. When we have a look at these keywords, we can see that “parent skills” has jumped from 25 to 10 and “parent’s” jumped from 19 to 8 in their rankings.
You can choose to filter other columns as well in order to do a deeper analysis. However with this page, we can say that Good Job Games, (publisher of House Life 3D) might have added the keyword “parent” to the apps’ metadata. When you mash together “House Life” and “parenting”, which is directly related with family and house, choosing this keyword is a clever choice. This insertion most probably made a leverage effect in searches on the App Store and the download performance of the game then increased.
This kind of filterings can be done to find out your competitors keyword strategies as well. Doing this allows you to spy on competitors strategies. And collect insights to design your own plans regarding keyword usages.
Filtering Alternatives
You can just focus on the keywords that have dropped below the ranking 10. Or keywords that have reached a higher ranking than 10. Even this simple analysis will provide you with very valuable information that can save your day.
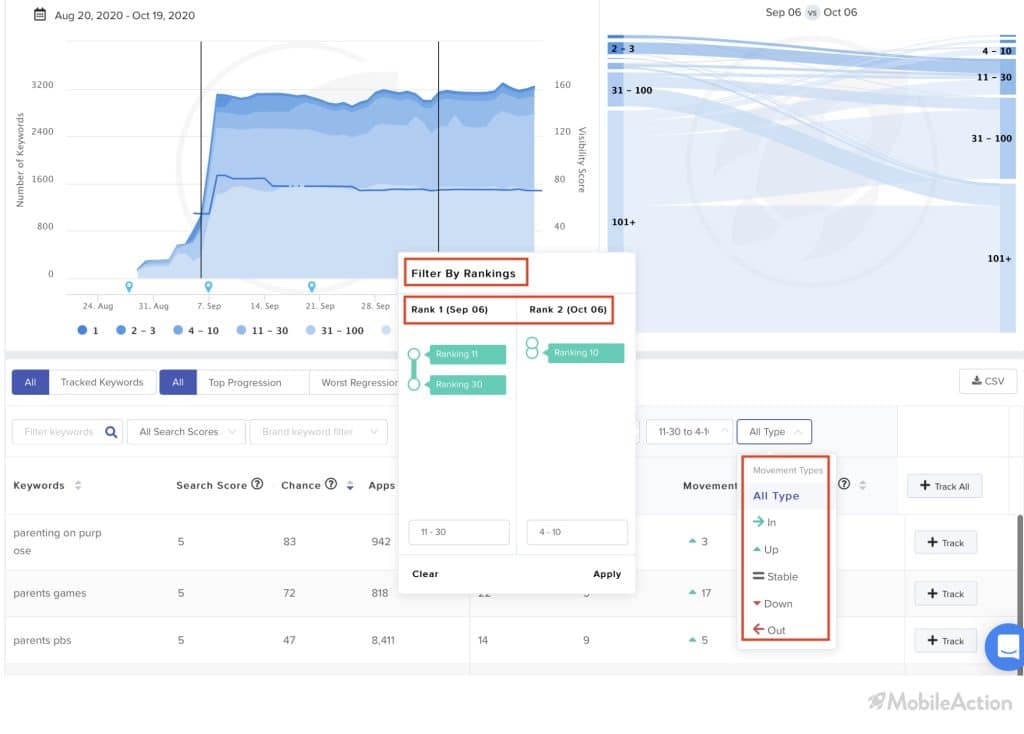
As seen on the screenshot above; there are multiple filtering options and options to choose specific dates that help with more specific analysis. If you want to see the difference in your app before and after an update; and want to keep a report of it, this is the perfect tool to help you.
Also in our platform, there’s a top progression and worst regression analysis option. With these tools, you can see the keywords which have never gotten into the list of the first 100 that now appear directly as ranking at number one, easily, or vice versa.
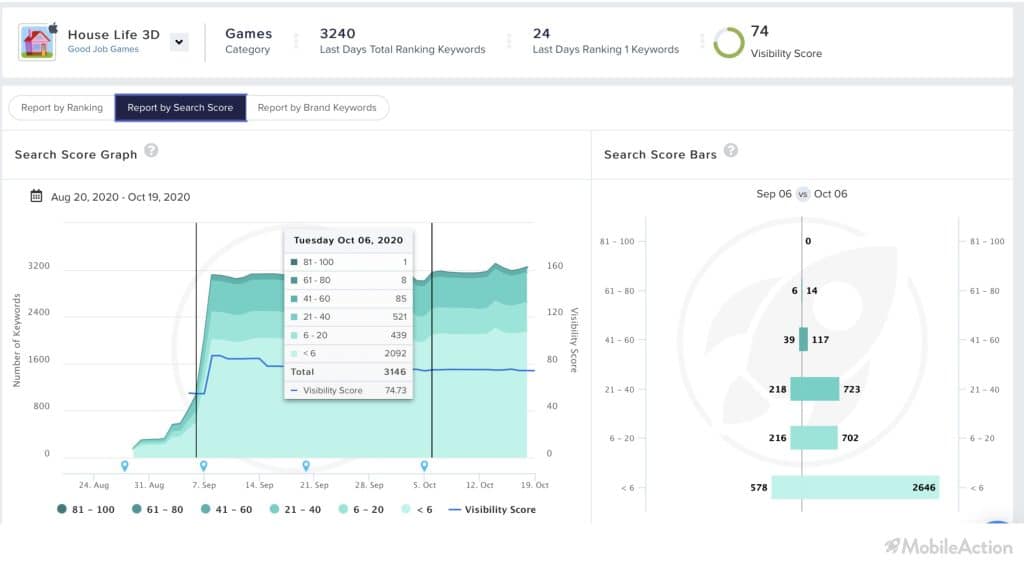
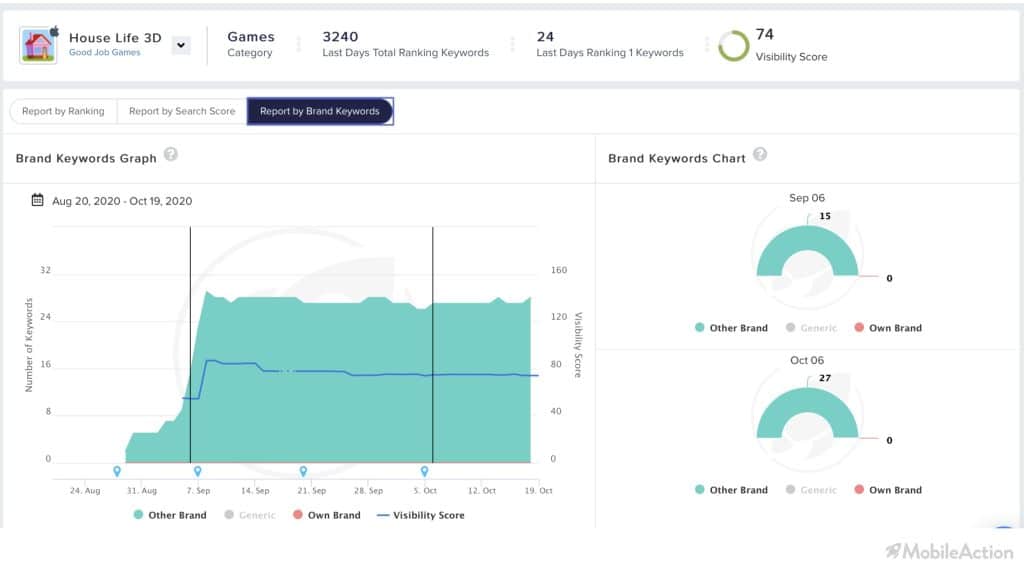
You can also choose to sort by report by brand keywords or report by volumes. If you choose to sort by volume, you are seeing the keywords that might have a high volume overall but have no use for the ranking of your app. This will help tidy up your keyword list accordingly.
- You will now be able to filter through; volume tiers, brand and generic keywords and, ranking tiers in a single view.
- Compare two different dates and review the change in rankings, volumes, and brand keywords from the table,
- Review the change in the charts over time. Click on any range to narrow down the search results in the table below.
The new version of the ASO Report would enable the user;
- to review an app’s rankings,
- see the keyword movements,
- track a keyword and,
- specify the search
according to several metrics in an easier way than it was before.
It would be safe to say that our ASO Report is the most comprehensive and easy-to-understand report.
On the ASO Report page, not only are you able to analyze your app’s keyword performances but also those of your competitors’. So another use for this page is analyzing when your competitors have launched an update. And see what kind of impacts this had on their app. After making an analysis you can take on their good and leave the bad decisions they have made on keyword level. The filtered analysis you get from our strong database and our revamped ASO Report page will offer you valuable information. So you can better your strategies.
Curious about our ASO Intelligence? Start a free trial today, or schedule a demo with us to discuss all your ASO needs and our solutions.
