Ever wondered whether the top apps in the top charts owe their success to only organic growth? Wish to know what it takes to climb up to the top of that chart in your app’s category? We have drilled down our database and found out the number of top apps that are using Apple Search Ads in each category. We have also calculated inorganic (SearchAds) visibility scores for the countries with high Search Ads penetrations. Here are some useful insights that you can use for your growth strategy:
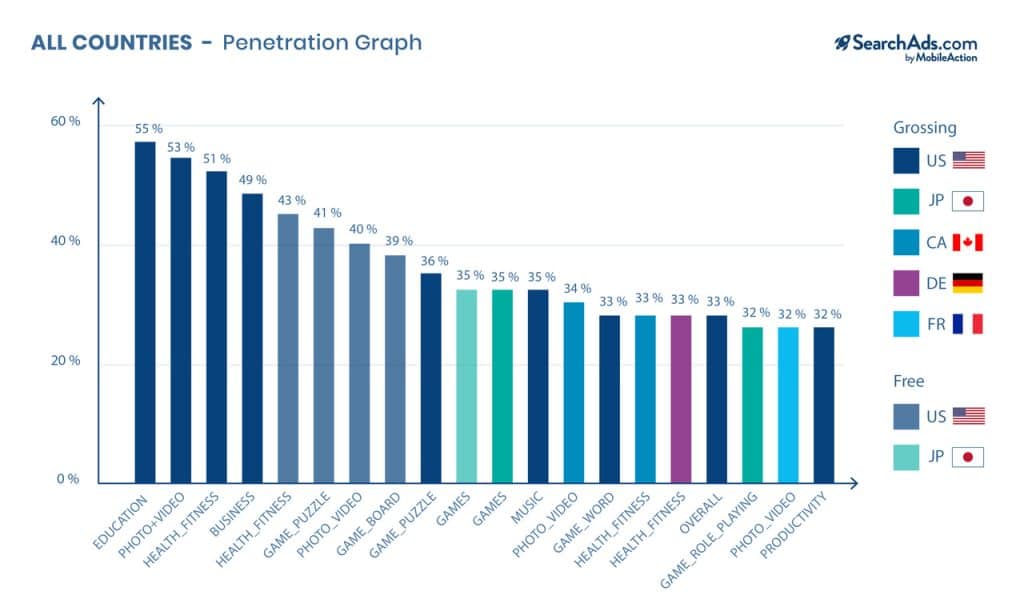
The above graph shows the SearchAds penetration rate of apps in the Top Charts in all countries. As you can see in the graph, top apps in the US has the highest penetration rate with 9 different categories. Apps in Education category in the US depend on Apple Search Ads more than any other category as 55 out of 100 apps in Education are using ASA.
You can also see that some categories stand out more than others regardless of the country. The apps in Photo & Video, Health & Fitness, and Games categories like to use ASA more than apps in other categories do, an insight indicating that these categories have a fierce competition in terms of ASA. Similarly, App Publishers who wish to make it to the Top Charts in the US market should start focusing on inorganic growth as soon as possible in order not to stay behind in the race.
Japanese Game Apps love Apple Search Ads
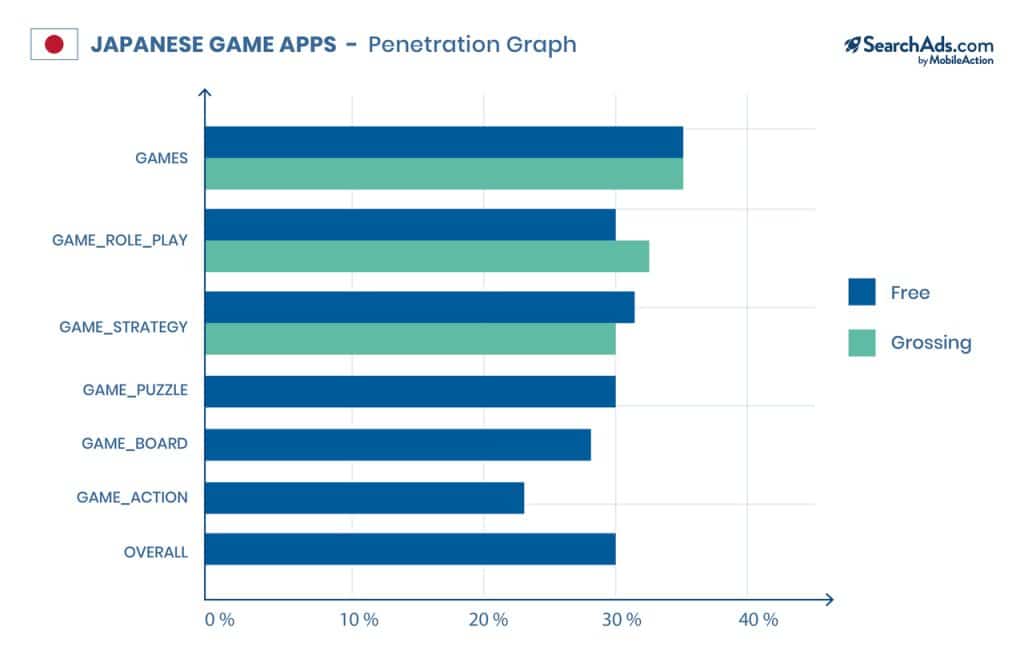
Game categories in Japan have made it to the top of the list for using Apple Search Ads more than any other category. While free and grossing top apps in Overall Games category are at the top with 35 apps in each, the apps in categories such as Role Playing Games and Strategy Games are also heavily using Apple Search Ads to boost their growth. Well… Now you know what to do if you wish to see your game in Top Charts of Japan 🙂
Grossing Apps in France also prefer ASA
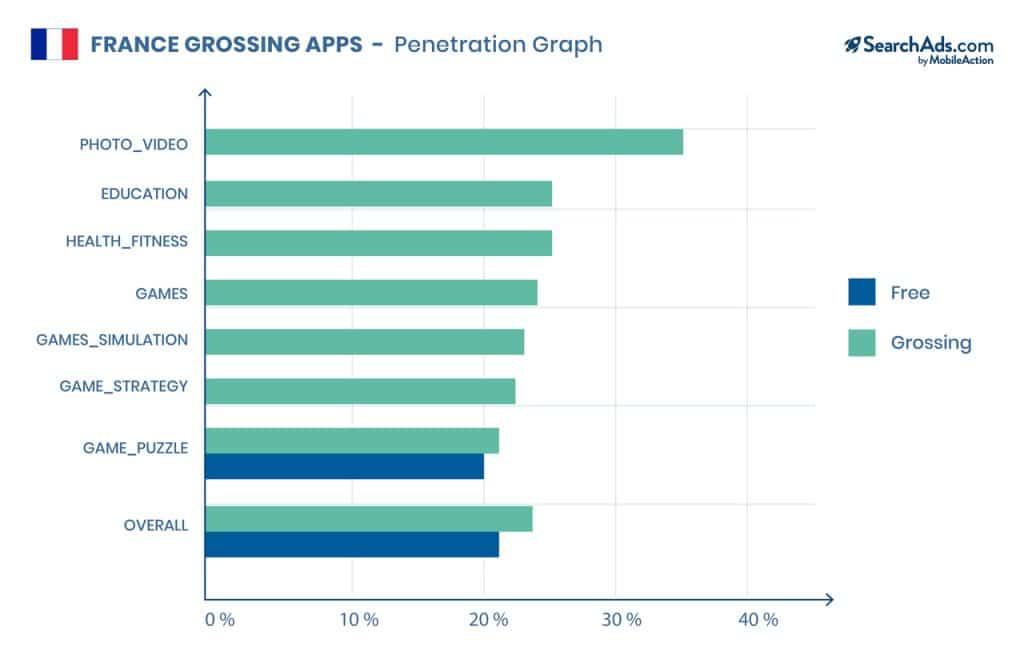
While both free and grossing top apps in other countries put great efforts into inorganic growth, we observe a certain trend in France. It seems that grossing top apps put more emphasis on Apple Search Ads than free apps do since the top 8 spots on the graph above have all been occupied by grossing apps.
Visibility scores for Search Ads
Similar to the visibility scores we have in MobileAction’s dashboard, we have calculated the visibility scores for inorganic growth as well. The graph below shows the top 20 categories with the highest visibility scores.
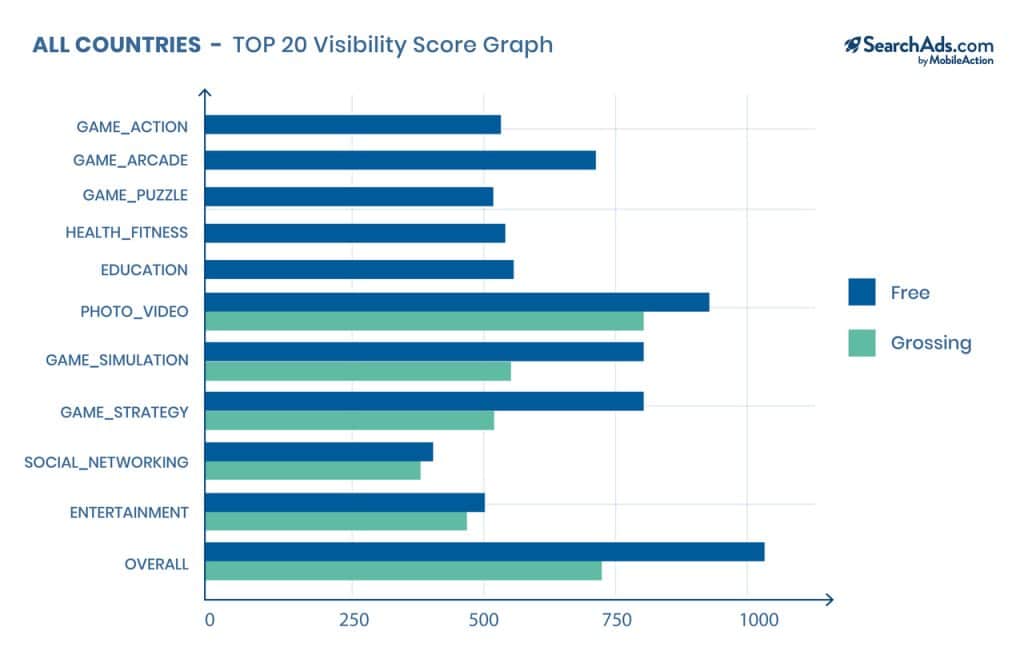
All of the categories above belong to the US market and have both free and grossing apps with fairly good visibility scores though there are a few exceptions in game categories. Photo & Video has inorganically most visible apps, and the top apps in game categories follow it.
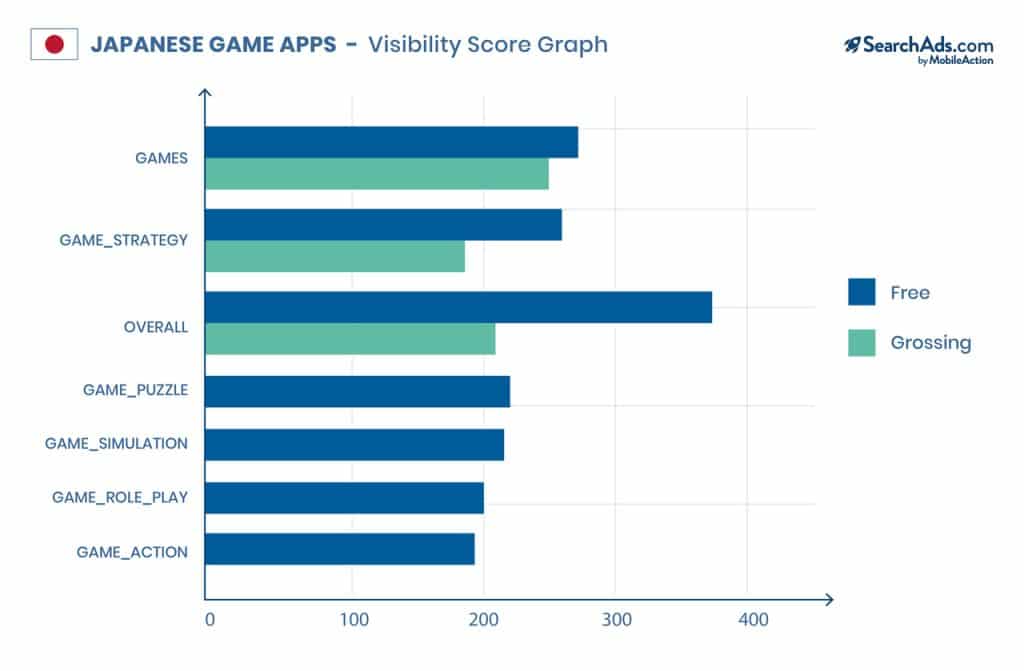
When we break it down into the different countries, unsurprisingly, we observe that game categories have the highest visibility scores in Japan. It turns out that ASA efforts put by Japanese mobile game publishers pay handsomely.
So, going back to the question at the beginning: “Are Top Apps Running Apple Search Ads?”, the answer is “Definitely yes!” and more importantly, the adoption of ASA is skyrocketing. It has already passed the 50% threshold in 3 categories of the US market, and other countries are likely to get in the flow soon.
Thinking that it’s time you started using Apple Search Ads? Check out SearchAds.com which is an integrated platform where you optimize your ASA campaigns and monitor the results. Schedule a demo with us to see how SearchAds.com can help you scale your campaigns and grow ROI.
