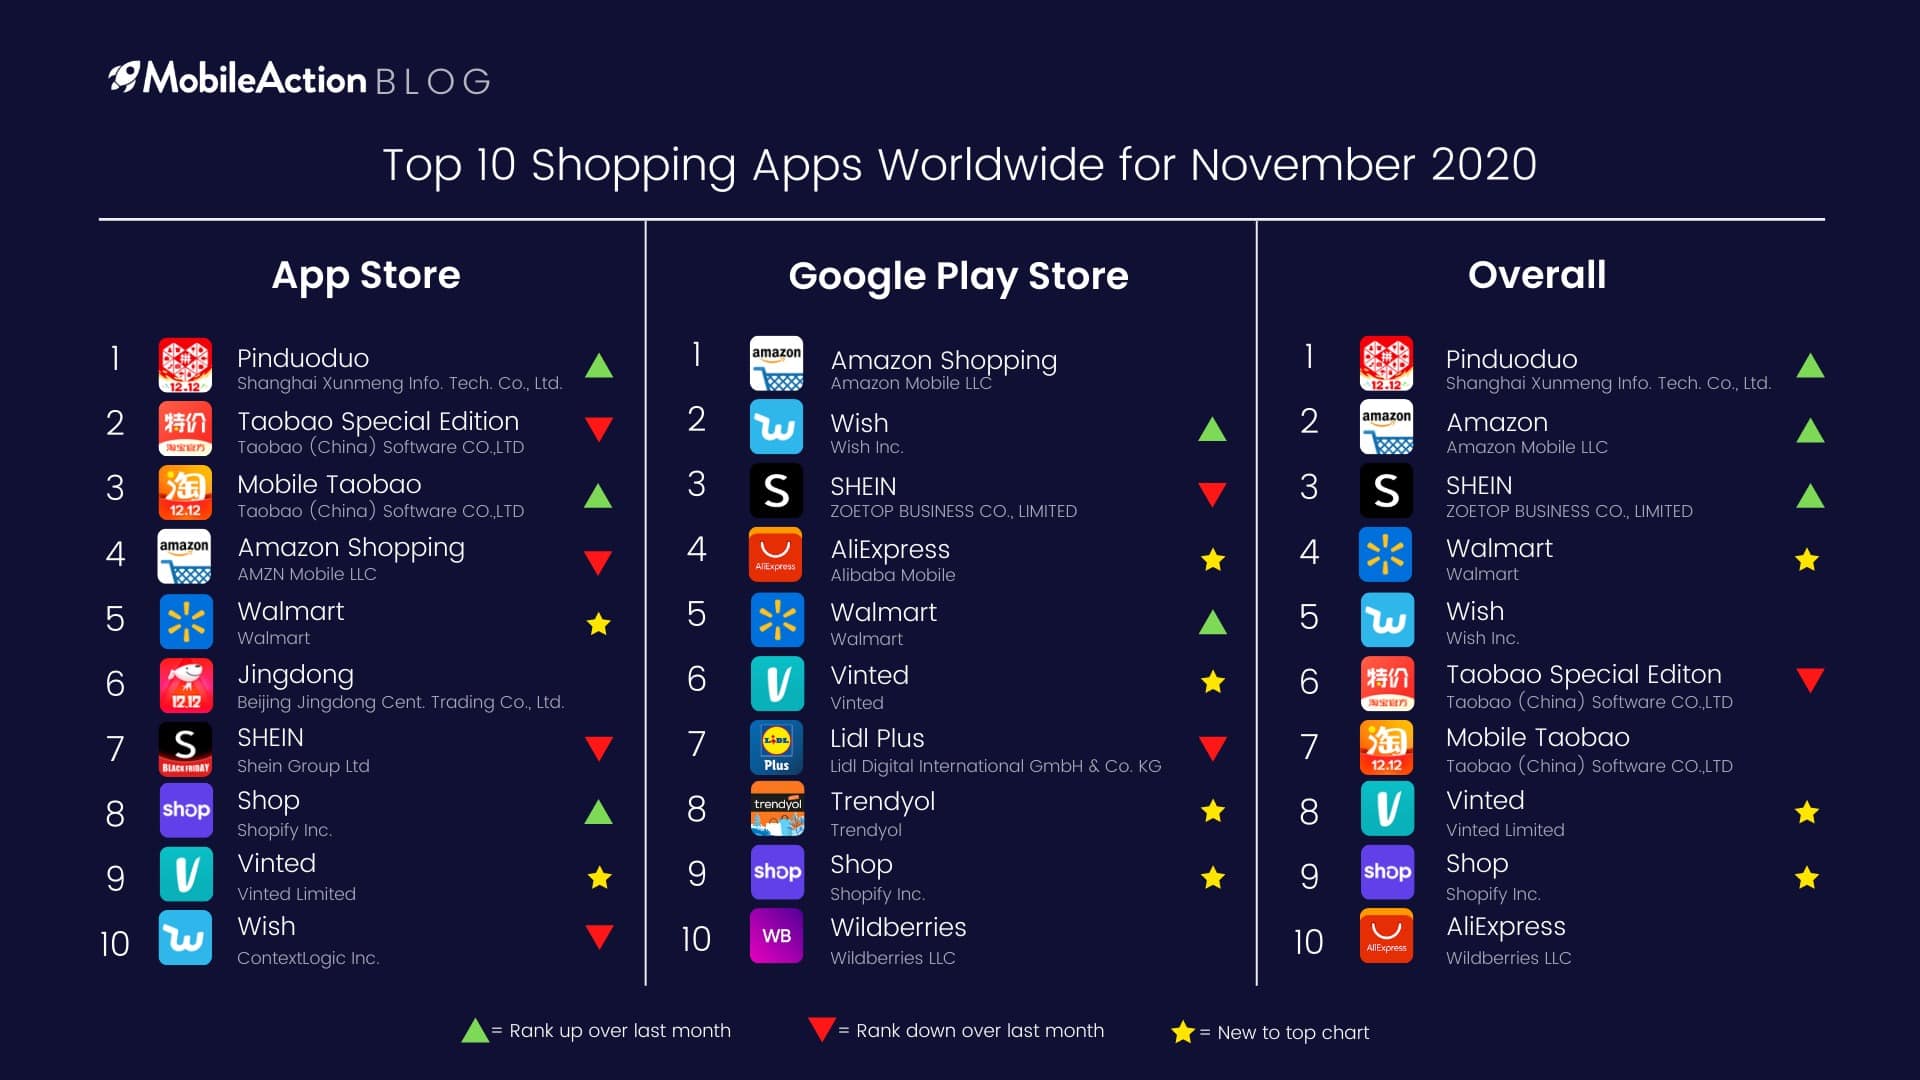
The online shopping sector can be considered one of the few winners of Covid. With people staying inside, online sales have been increasing since the start of the pandemic. Especially on Black Friday, unprecedented amounts of shopping was done online. Thus November is the perfect month to take a look at the Top 10 Shopping Apps worldwide.
This category is usually dominated by some very big players. Especially in the Apple App Store, China originated apps such as Pinduoduo or variants of Taobao lead the charts per usual. In addition to these Chinese Apps, there are also some strong American players such as Amazon and Wish. With some apps reaching over 10 million estimated downloads, it is definitely difficult to enter these charts.
The American retail giant Walmart has managed to enter the lists in November, securing its place as the 5th most downloaded app both in the Apple App Store and the Google Play Store, while being 4th in the overall category.
Even though Walmart is pretty popular in the USA, its downloads were not enough to rank on the global lists prior to November 2020. This month Walmart increased its downloads so much that it entered the global charts.
Let’s take a closer look at Walmart’s metrics for November and try to determine the impact of Black Friday and Cyber Monday on this app.
Category Rankings
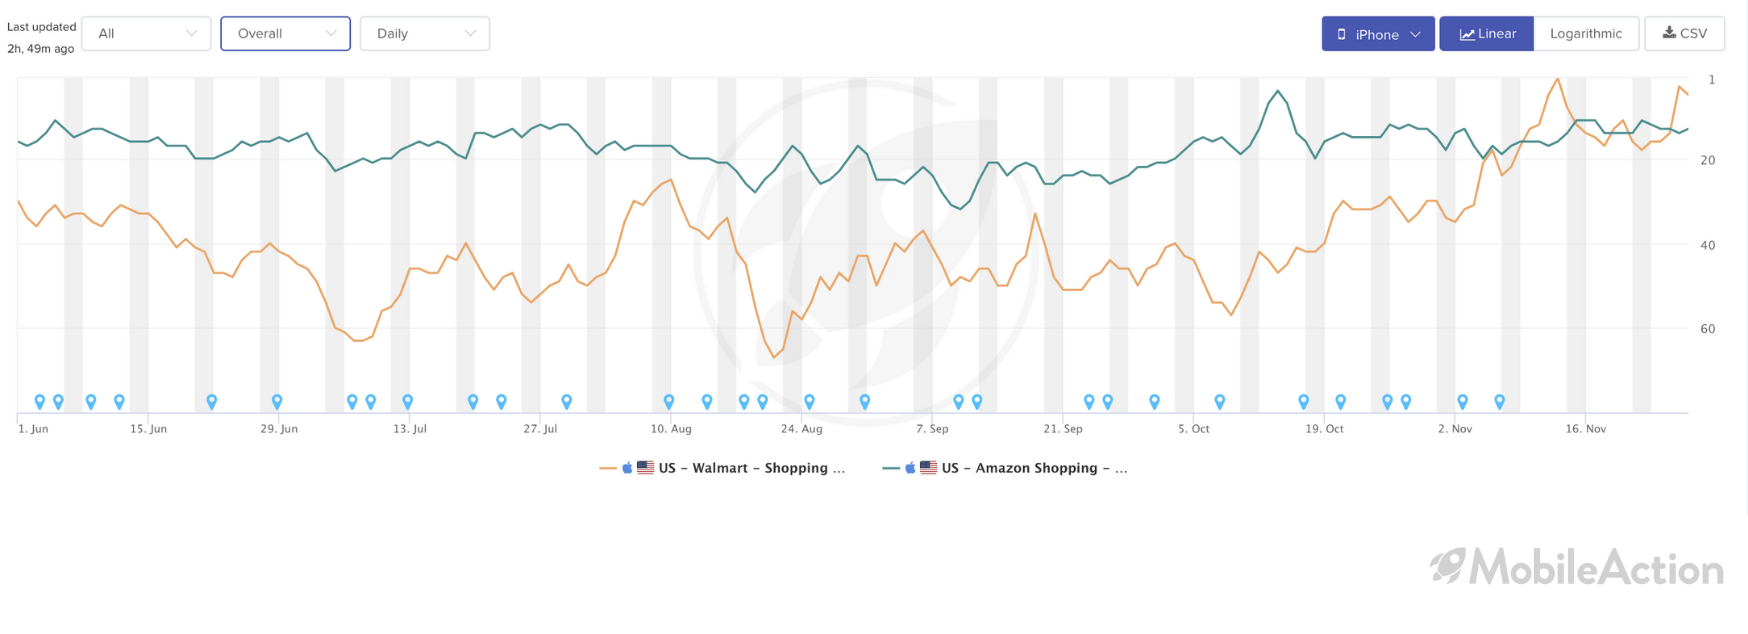
As mentioned before, Walmart is a highly localized retailer. Thus, even though this is a post about global charts, using Walmart’s Category Ranking history in the USA can help us gain some perspective.

Ranking high in your category is not always enough to push you to the top of the overall charts in the App Store. This was clearly the case for Walmart. Even though it was always ranked high in the shopping category, its overall ranking was not as impressive, reaching below 60 during August. The green line represents Amazon’s ranking in the overall list in the App Store. As it can be clearly seen, Walmart rallied to the top of the list with the start of November. Even though Amazon is a global player, it appears that Walmart increased its dominance in the US market so much that it has caught up with and even surpassed Amazon.
Campaign Analysis
With a brand name as strong as Walmart, there is no doubt that organic growth has been strong. Still, by using the Campaign Analysis tool let’s take a closer look at Walmart’s advertising strategies

It appears that Walmart is not giving much importance to a paid growth strategy. The dominant ad network of choice appears to be Facebook with a 94% share while Admob is used for the 6% left. They are using only 48 publishers to showcase their ads and 88% of their creatives are images. Their rank of 5731 in the Overall Advertising list shows that paid growth is not very central to their UA strategy. Walmart is currently using only 22 creatives.
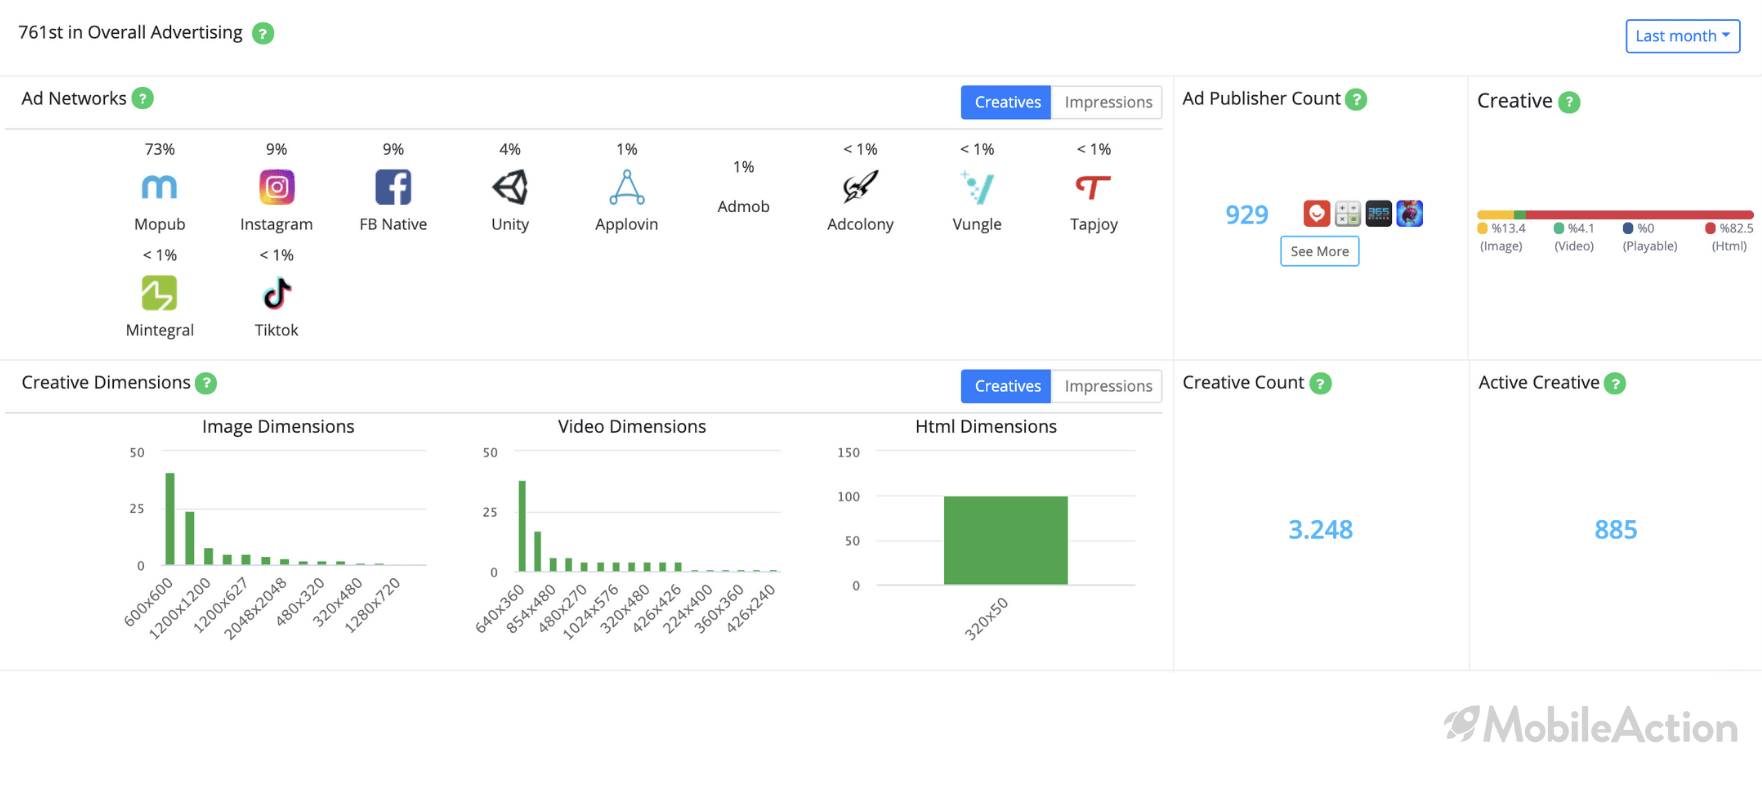
It is very impressive for an app that does not employ paid user acquisition strategies to enter the overall lists for the Shopping category. If we take a look at Amazon’s Campaign Analysis, we can appreciate the difference in strategy between Amazon and Walmart.

Amazon ranks 761 in the overall advertising list compared to Walmart’s ranking of 5731. Amazon is using 929 apps to display their ads, while 885 of their creatives are currently active.
The difference between the metrics of Walmart and Amazon is astounding. Especially when we consider that Walmart has managed to catch up to Amazon while giving so little importance to paid user acquisition. This is a very considerable accomplishment which proves the importance of having a strong brand name. If Walmart was not already a huge player in the retail sector, it would be very difficult for them to rank on the global list.
ASO Report

Mobile Action’s ASO Intelligence tool provides us key metrics about the app’s organic performance. First of all, we can see that Walmart has a Visibility Score of 92 which is an impressive number. When we check out their Report by Ranking, we can view the number of keywords that the app is ranking on.
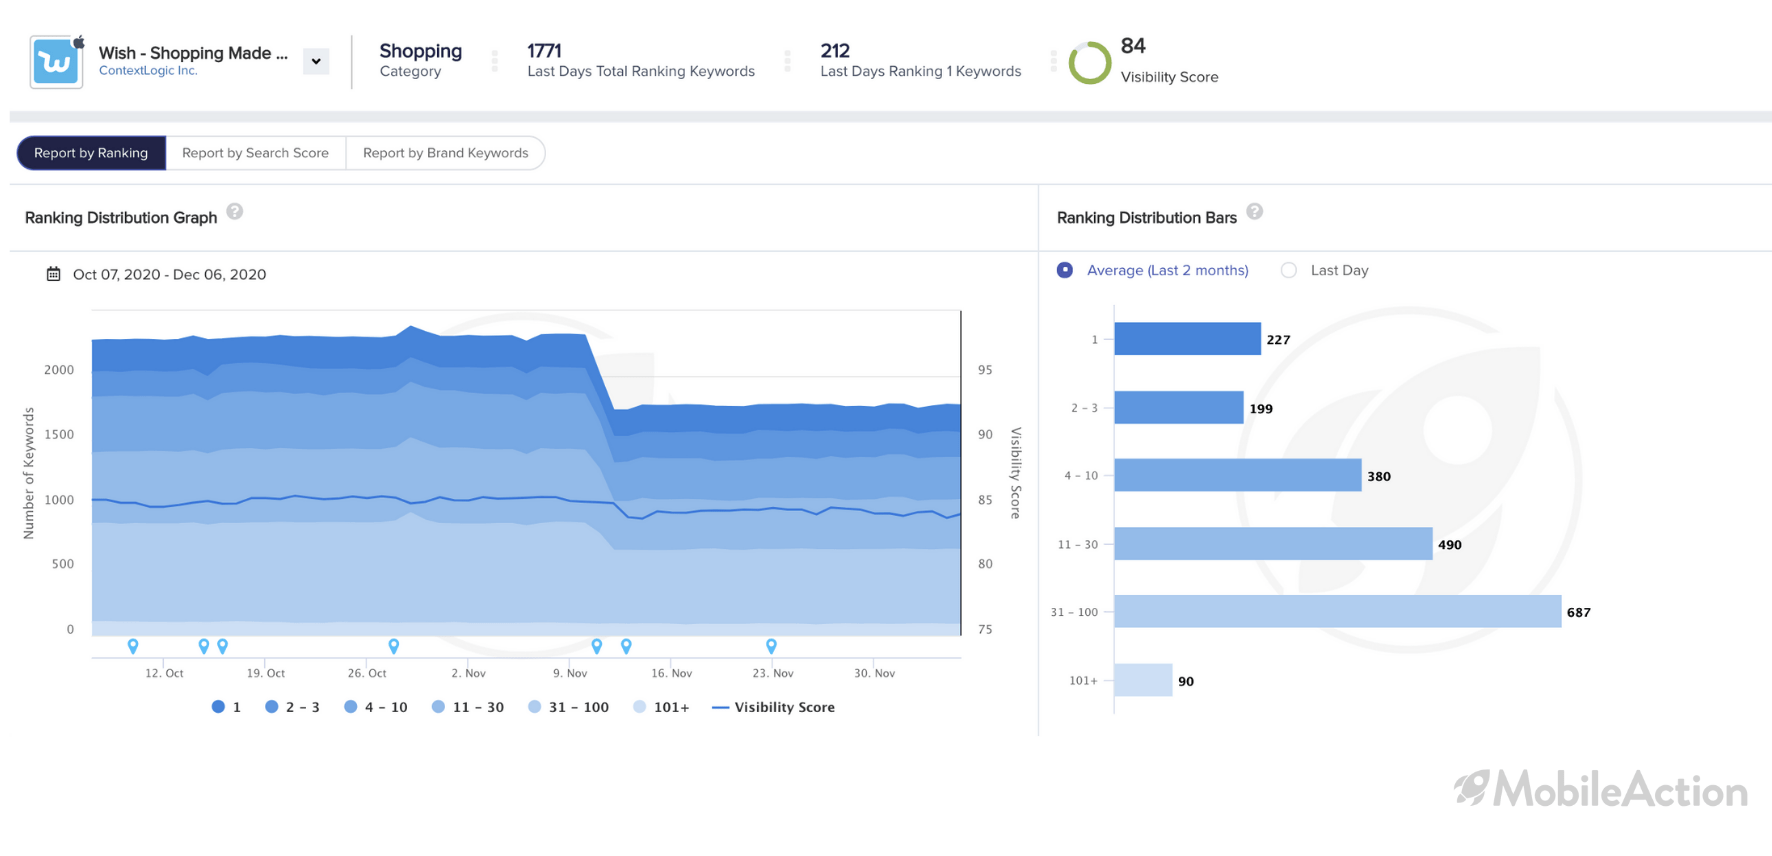
Walmart is ranking on a total of 1475 keywords. This number by itself is not very impressive as apps in the same category have similar/higher totals. But the shape of the distribution grabs our attention. To illustrate my point, let’s take a look at the ASO report of Wish, a close competitor in the Shopping Category.

As you can see Wish is ranking on 1771 keywords, which is more than Walmart. But when you look at their ranking distribution, you can see that the bar chart is skewed. They might rank on more keywords, but their median ranking is lower. This is why their Visibility Score is lower compared to Walmart. The saying “quality over quantity” seems to apply to the mobile app market as well.

When we check out their Brand Keywords Report, we can see that Walmart is ranking on 58 brand keywords of other apps. This could be another reason for their dominance in the U.S market. Their high visibility score combined with their ranking on other brand keywords allow them to attract large amounts of users, making the app organically strong.
Key Takeaways
Online retail giants have been increasing their sales volumes thanks to the pandemic. China and the USA appear to be the market dominators for the shopping category. Walmart has managed to enter the global lists for Shopping Category through a user acquisition strategy that focuses nearly exclusively on organic growth. Once again we can see how powerful ASO strategies can be when it comes to growth.
You can use Mobile Action’s ASO tools to increase the organic strength of your app. Schedule a demo with us today and let us show you the power of our intelligence products!


