There’s a serious amount of competition going on in the ad world. Whether you are an app developer or a gamer, you probably have seen many apps that are so similar to each other they could be identical. Competition always exists and when one sees a trend is working well, they will want to hop on that train as well. So, it is important to be on the lookout for new ideas even if you might have been the first to start something. One of the ways for this is using ad strategies.
Nowadays, the interest in puzzle games and more specifically brain puzzle games have been rising thanks to influencers/gamers and ads. We have looked more into detail with two similar game apps using our Ad Intelligence tool to see how the ads and creatives they use can help apps rank higher.
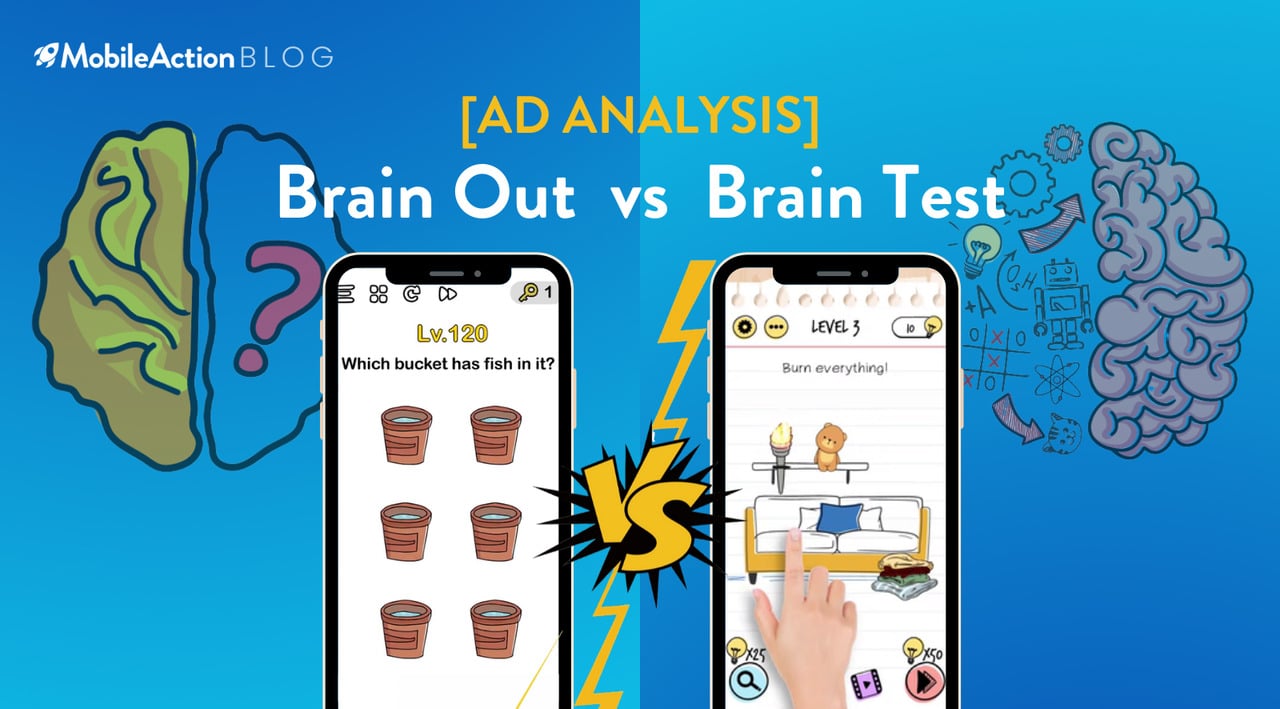
We have two similar apps here Brain Test: Tricky Puzzles and Brain Out.
Category Ranking Comparison

Category ranking comparison of Brain Test and Brain Out in Games Category
We can see that in the past days, Brain Test has been ranking higher than Brain Out in Games, even ranking at 1st for some days, and in the past month, the lowest it has been was number 10th, still keeping its place in the Top 10 consistently. Meanwhile Brain Out never went beyond 20th in the rankings the past month.

When we look into each apps’ profiles and their download vs revenue estimates we can see that Brain Test has doubled Brain Out on both of those categories. And has a visibility score of 92 compared to Brain Out which has a visibility score of 84.
We can assume that thanks to their ASO efforts both apps have good visibility scores. But the category rankings above show us Brain Test is performing somehow better than Brain Out. Let’s see how these apps are doing on the paid user-acquisition side by diving deeper into campaign analysis.
Campaign Analysis: Diving deep into the creatives
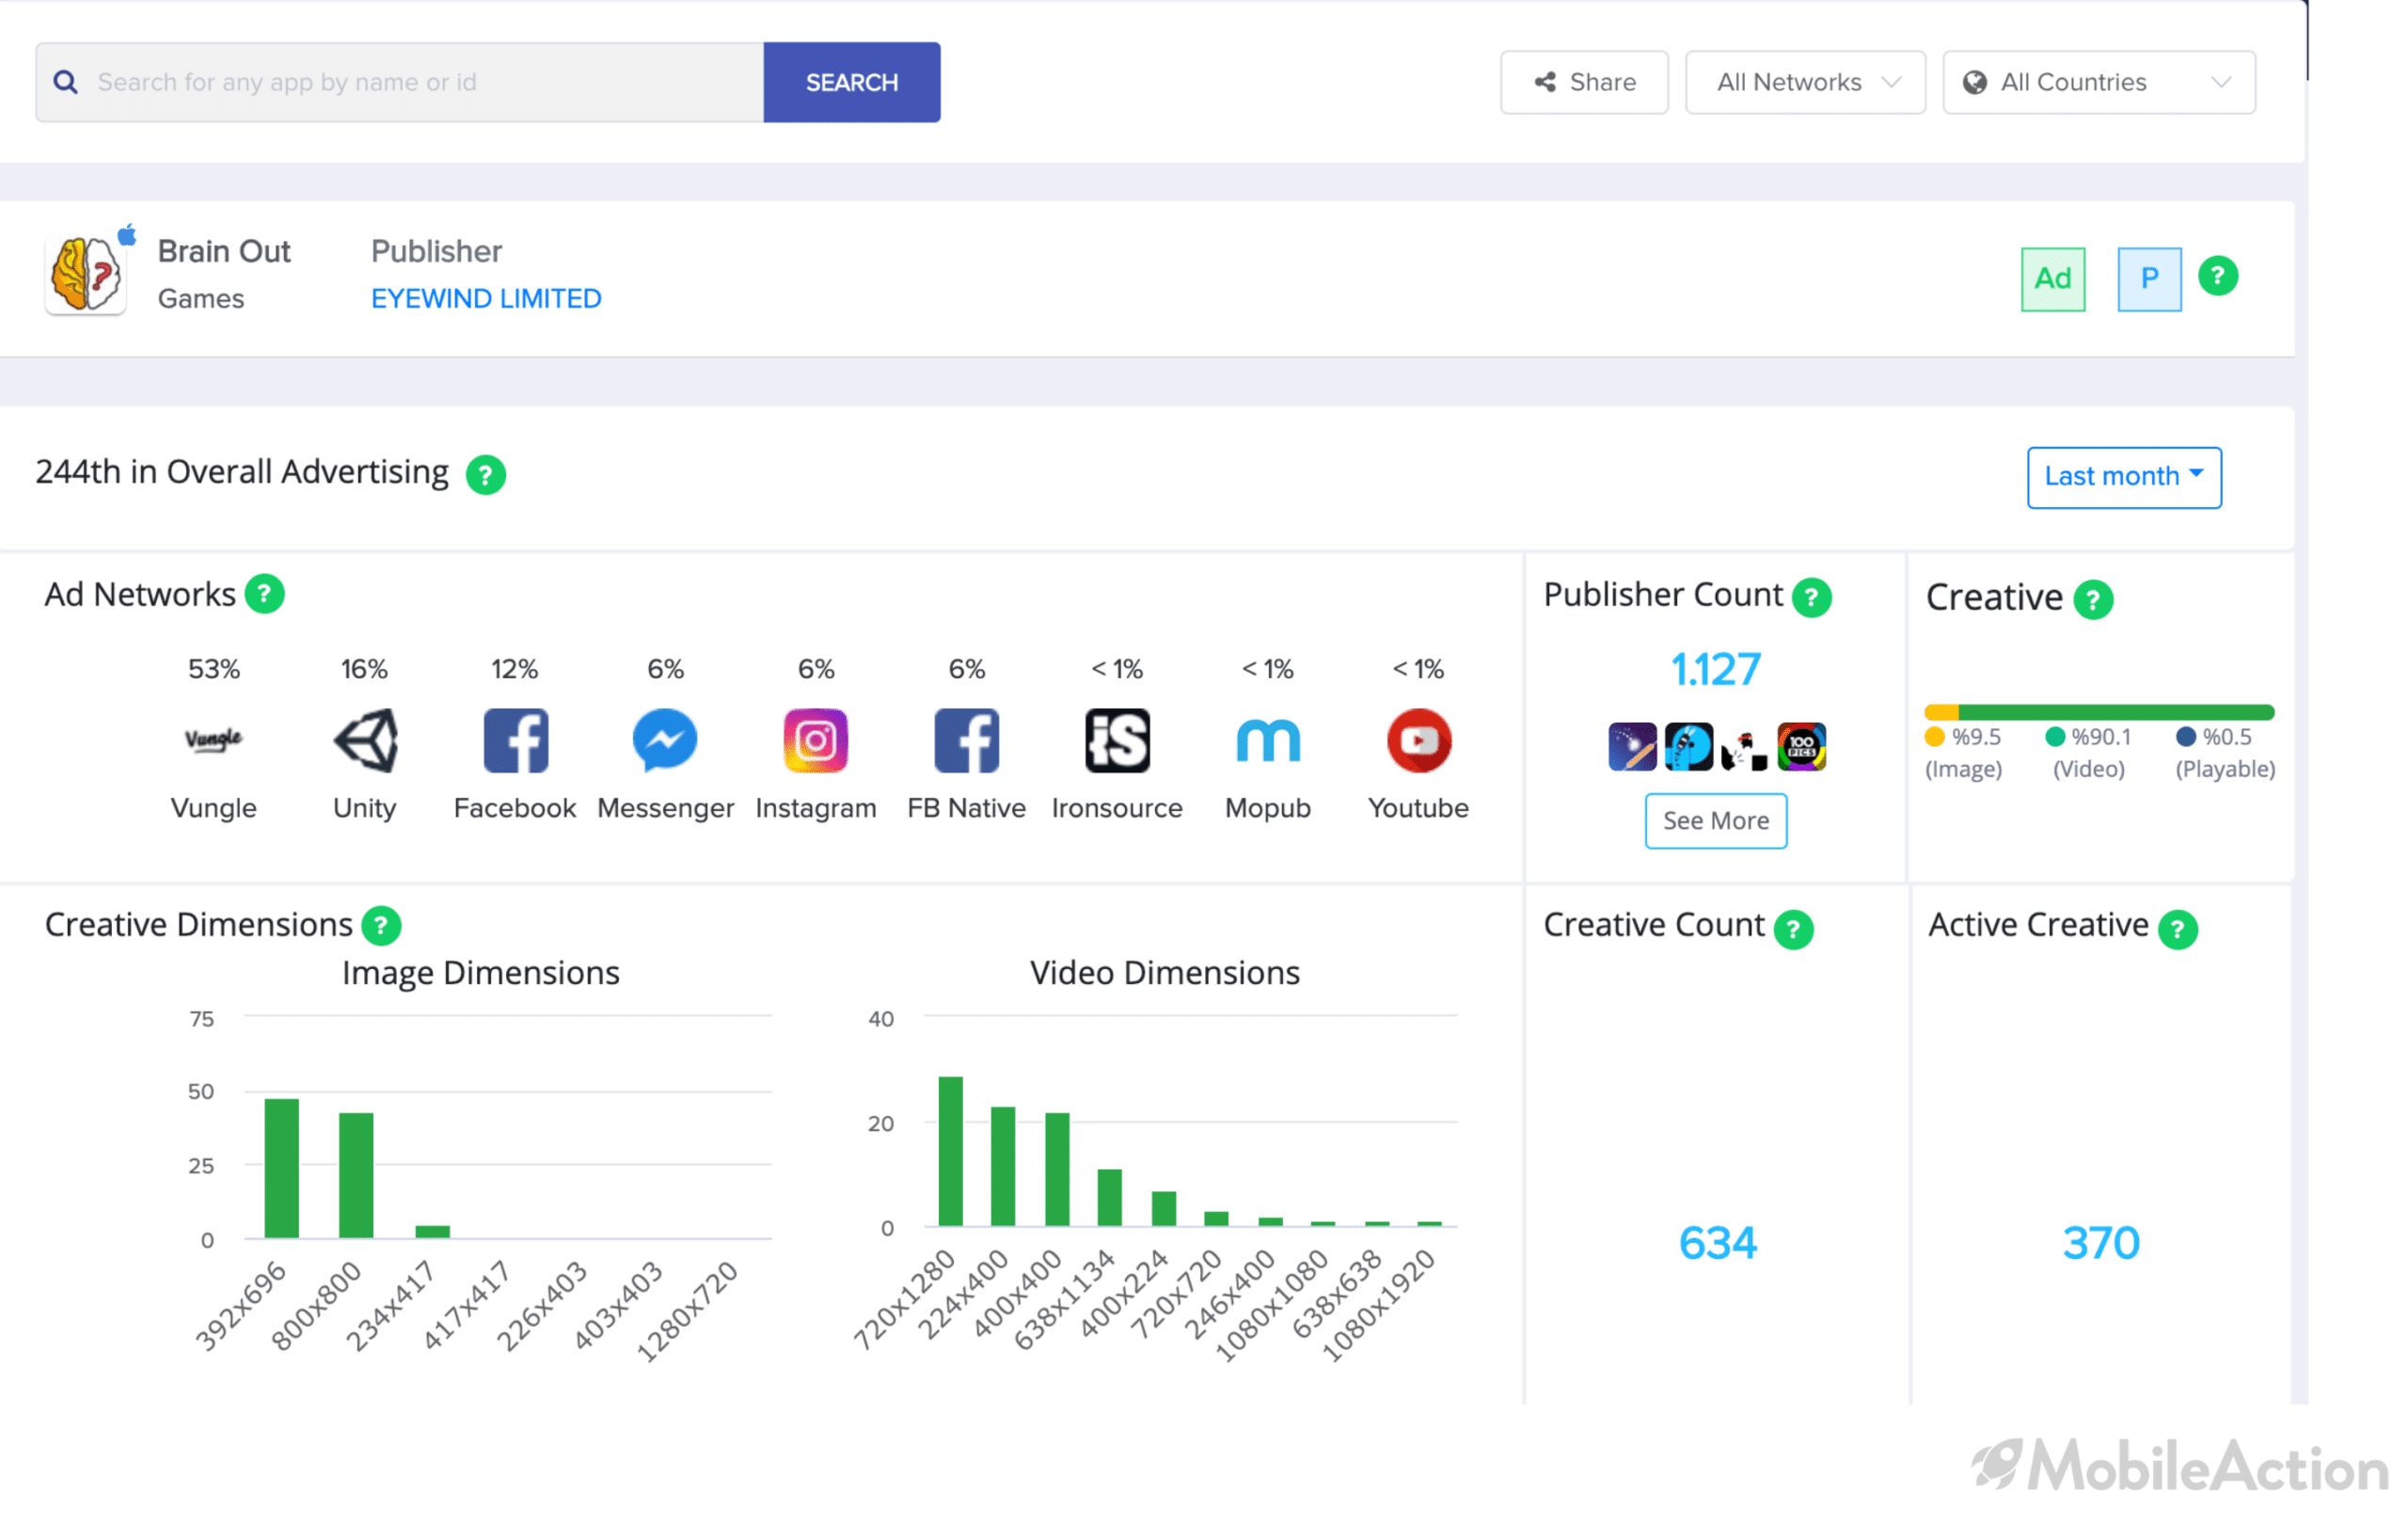
Looking at Brain Out’s Campaign analysis we can get an idea of insights, such as how many publishers are currently running their ads, how many creatives it has and how many of those creatives are currently active. We can also see the distribution of those creatives, whether they’re mostly made of images, videos or playable.
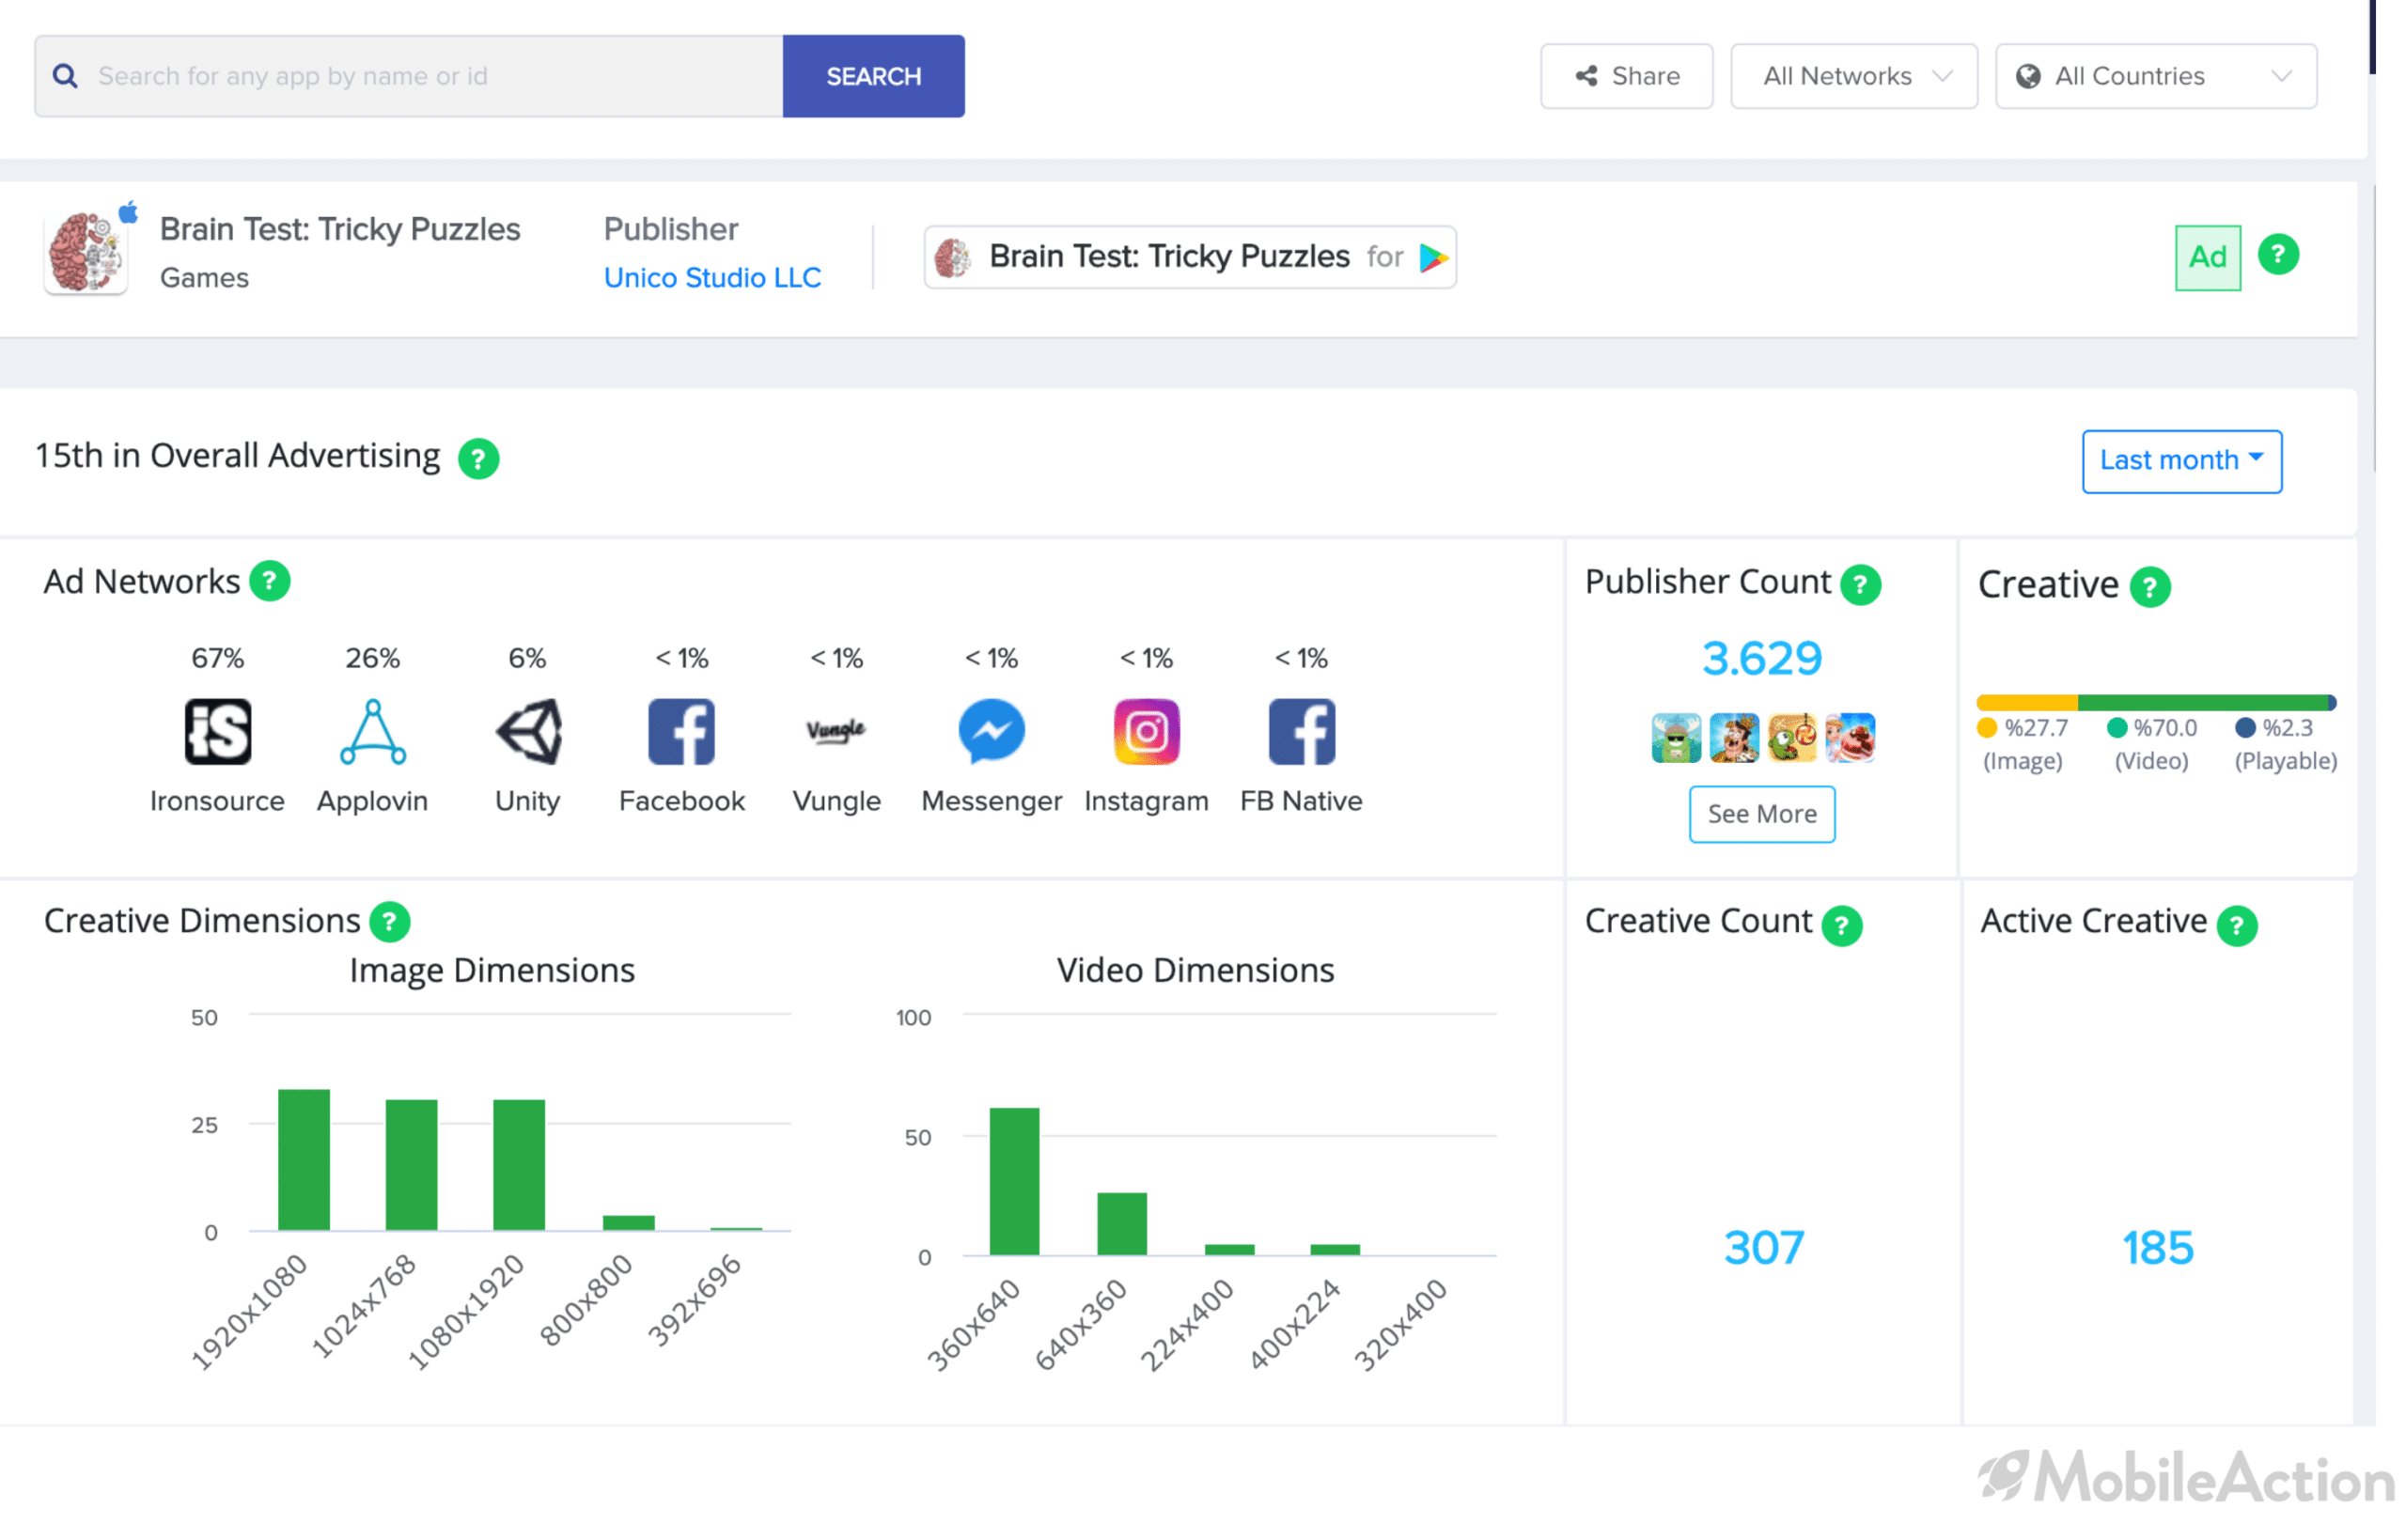
When we look closely at both apps and compare, we can see that Brain Out has a higher creative count, which is 634. But when we look at its active creative count we can see that about 42% of those creatives are active, while Brain Test which has higher active/total creatives percentage at 44%.
This might indicate that Brain Test is better at utilizing its fewer creatives. They might also be better at running A/B tests. Overall, having a better usage and grasp of their fewer creatives, they’re working smarter rather than harder. Indeed when we look at how Brain Test distributed its creatives from the Creative Tab, we can see that it has more variety, focusing not only on videos but on images and playable as well. Brain Out also has playable ads. But its percentage stands only at 0.5% while Brain Test’s playable ads take up 2.3% percent of its total creatives.
Publisher Count Comparison

Brain Test also has a higher publisher count of 2,863, compared to Brain Out who has 1,010. This means that Brain Test’s ads are being shown in more apps despite Brain Out being more aggressive with its creative count. When we look into who the publishers are we can see that the list is made up of almost all game apps and we can also see them based on impression scores.
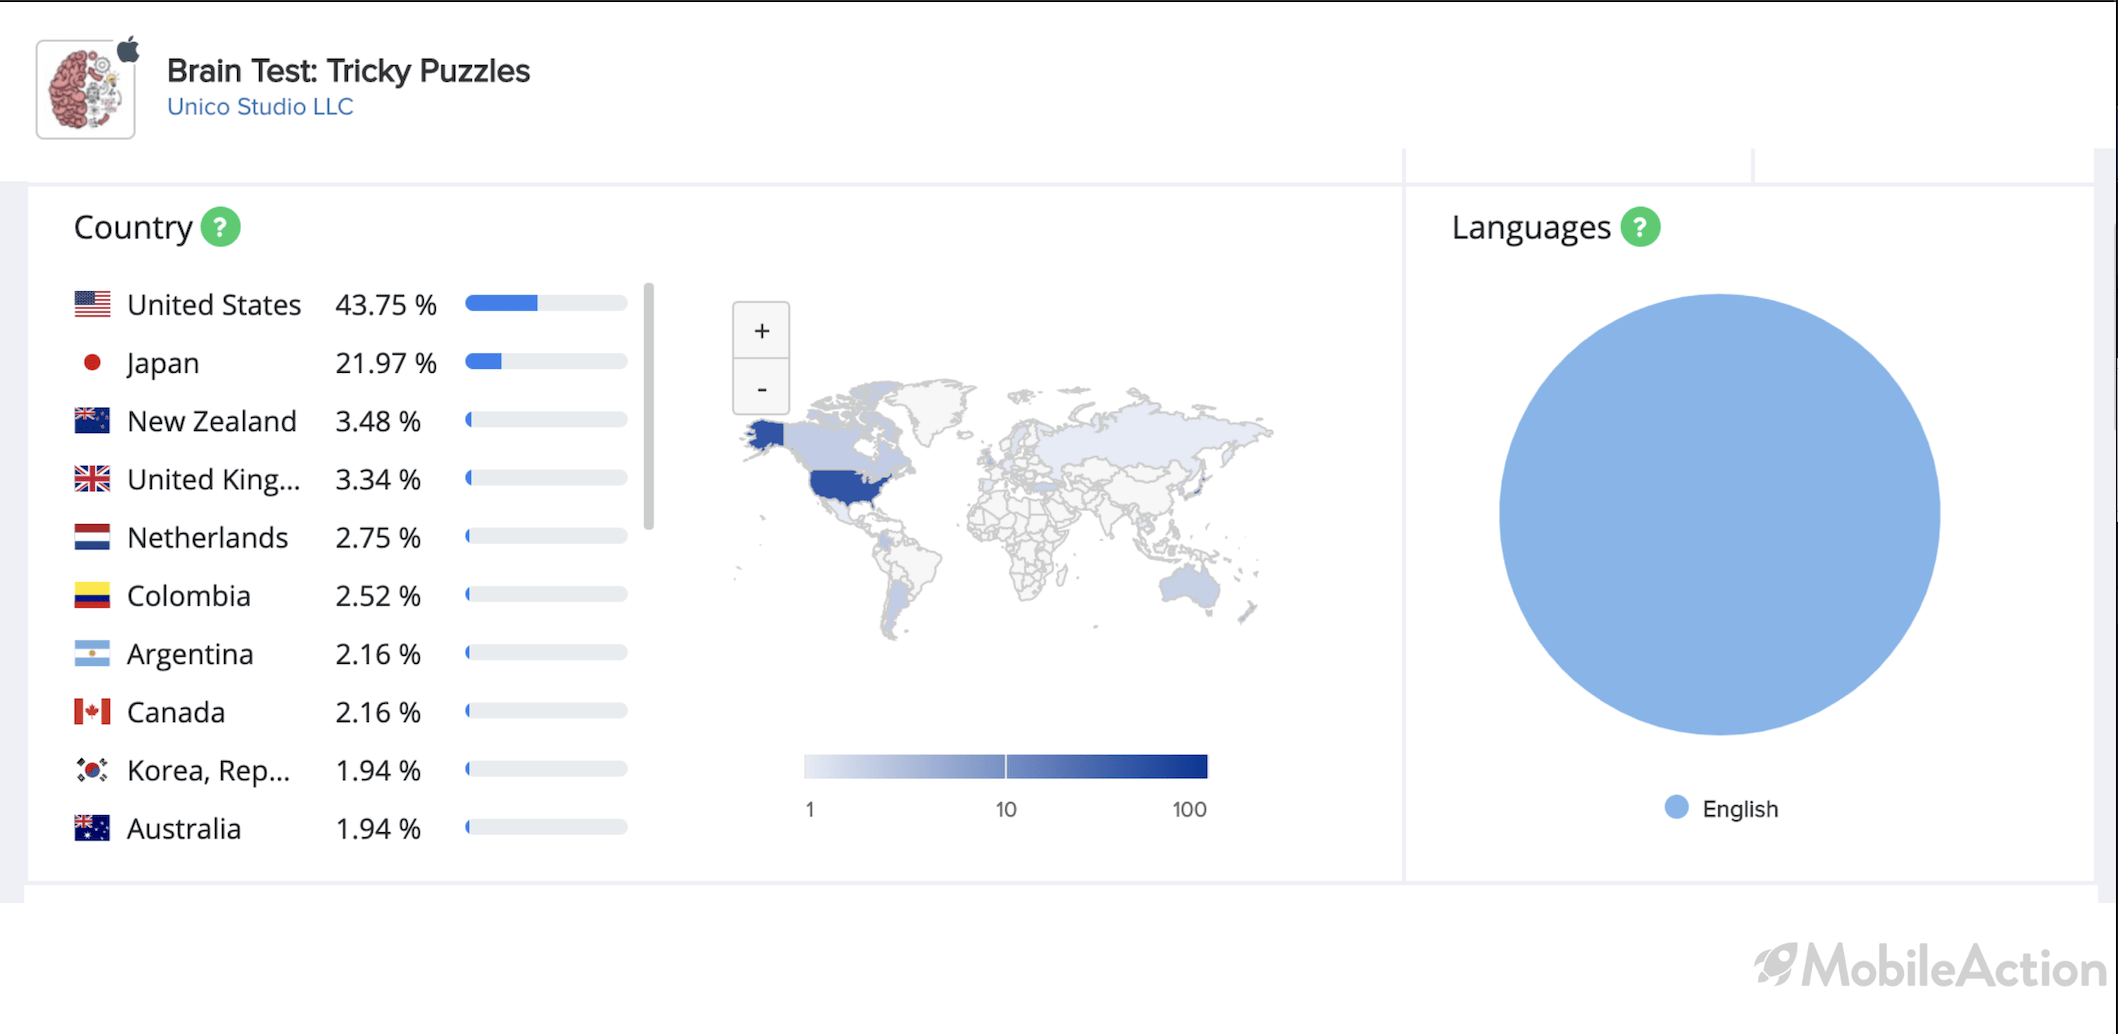
Brain Test also focuses on showing most of its ads in the US, 43.7% of all its ads are available there and in second place comes Japan with 21.9%.
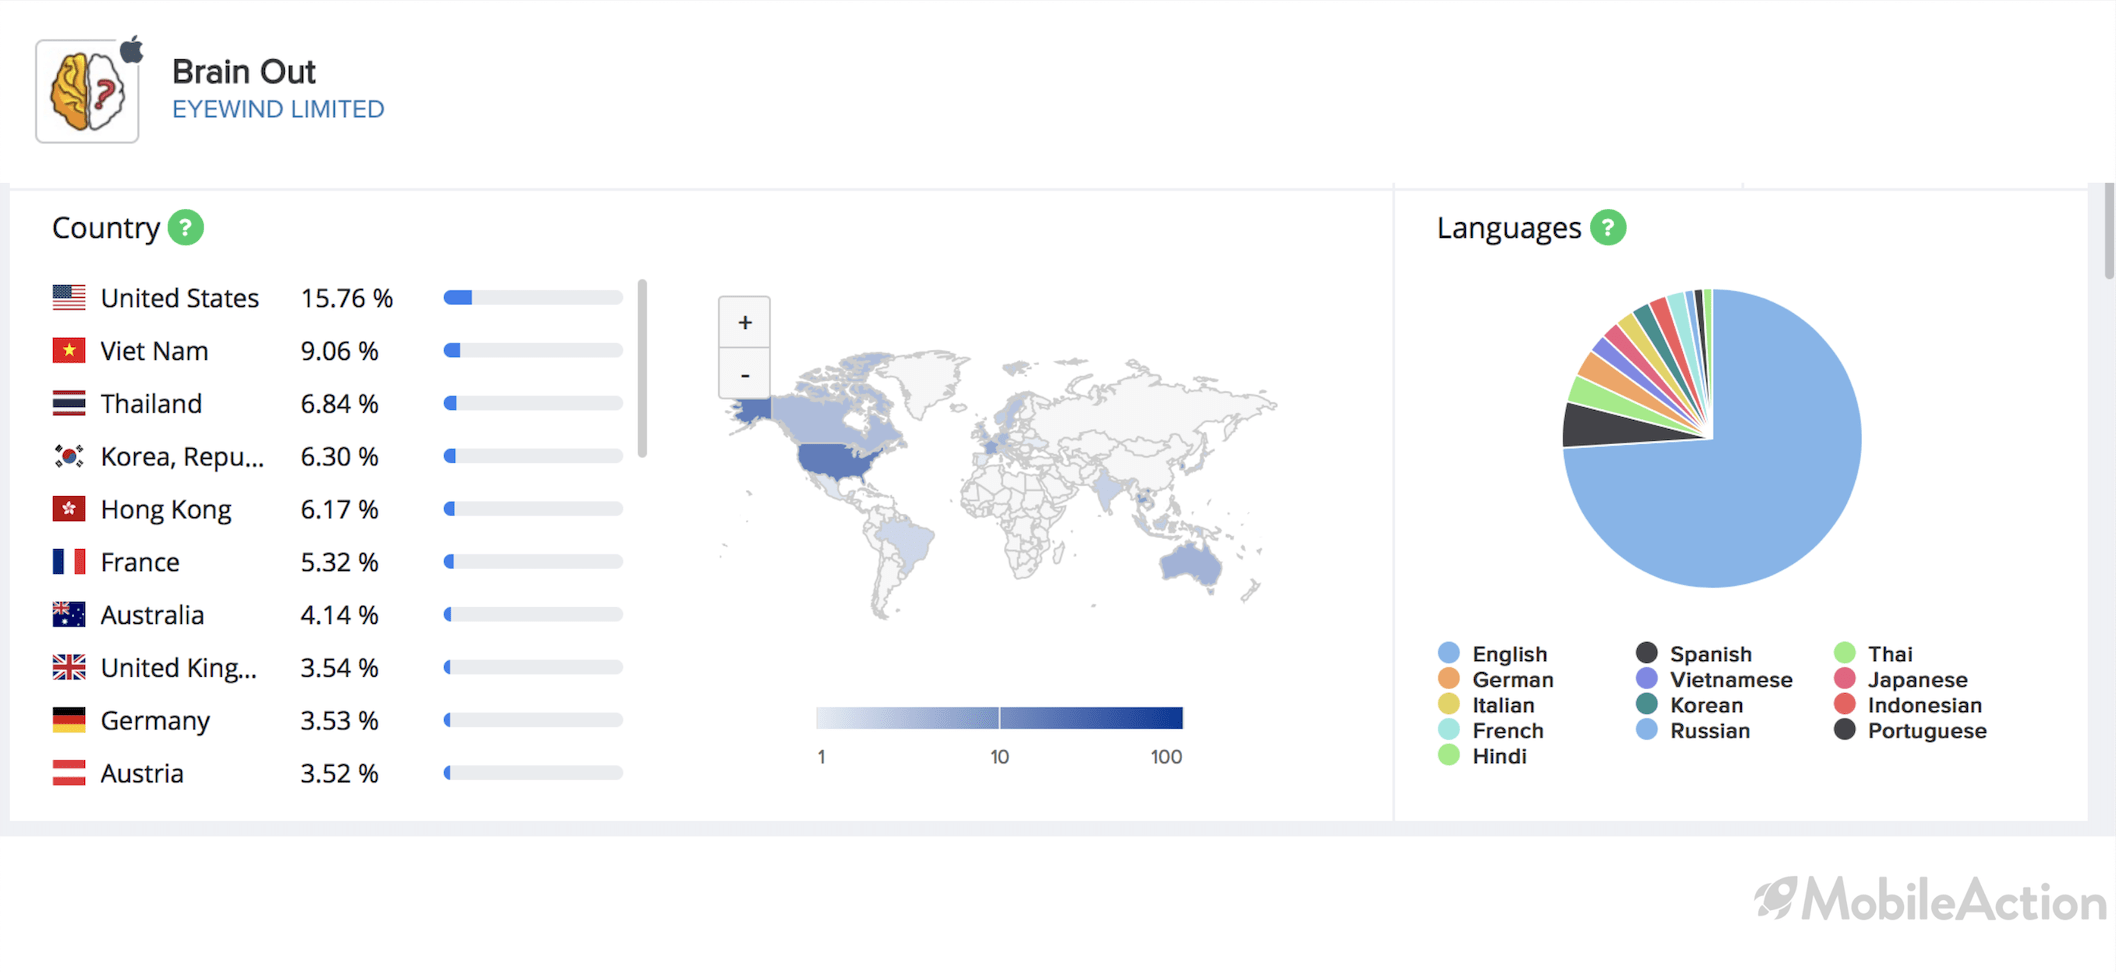
While Brain Out has its creatives more distributed, giving 15.7% to the US and the rest being divided up in multiple countries.
Video Creative Example of Brain Test
Another important factor is the content of creatives. Like we have said having a higher number of creatives isn’t everything, as we can see from the two apps’ placements from Top Charts and Top Advertisers too. To get a more in-depth look at how Brain Test got ahead of the game with one of the key strategies, the content of its creatives, we can take a look at Top Creatives at the bottom of our Ad Intelligence tool.
When we look at which creatives have done better for Brain Test we can see that it’s the playable ones along with the videos which take up around 71% of its total creatives. Same as its playable creatives, the videos are reflecting of real gameplay from a first-person point of view. They show exactly how to play from the first-person point of view and give the potential customers a sense of playing the actual game, ending with phrases like ”try it yourself” to encourage the target audience to download it.
In Google Play Store, Brain Test focuses most of its creatives in videos again and gets a good amount of interaction from there too, about 15%.
Lessons Learned
Some things that Brain Test: Tricky Puzzles did right and even better with its ads strategy:
- While Brain Test didn’t go as aggressively with its creative count, it published its ads to more publishers, giving it more in ad numbers.
- More of its creatives were playable and videos.
- Chose a more selective route with ad localization and focused more on countries with more users while still being active in a list of different countries.
The competition in the ad world, especially with games, is aggressive and constant. To keep at the top of the charts and reach a variety of users and downloads it is important to not only rely on numbers but also content.
We hope you enjoyed this blog post comparing the two game apps and their approach to ad strategies. Let us know your opinions in the comments and don’t forget to subscribe to our newsletter for more actionable insights.
Interested in seeing more about ad strategies? Check out Campaign Analysis to find insights about user acquisition strategy for any app. Or schedule a call to let us show you more insights about the app industry.
