SearchAds.com platform allows you to see the Apple Search Ads and Mobile Measurement Partners data in one single dashboard, and thus allows you to make your data analysis quicker and easier. But what is better than seeing 2 different data points in one single dashboard is to be able to see both MMP and Apple Search Ads data in graphs and visualizations together. The new feature of SearchAds.com, the Funnels page presents you this competence; to see the adjustable data in graphs with breakdowns of your choice. You can see the amount and conversion rates of any metrics that are important for your app; installs, trials, subscriptions, purchases, and so on. Let’s see how to use this feature in the most effective way.
Funnels page is the right place for you to identify the audience you should target
Using the funnels, you can easily determine which target audience performs better for you. You can simply choose the ad groups that have different targetings, and see the breakdown of the metrics for each of them. Let’s say you have trial, subscription, and purchase in-app events in your app. You are also using a range of age targets in your ad groups. You want to compare the performance of each of them.
So first, let’s select the first targeted ad group to compare. It is the one we target the 24-34-year-old age group.
Then, turn off the toggles of the metrics you don’t want to display in the graph. Here we want to see the conversion rates of trial, subscription, and purchase events of this ad group targeting 24-34 age range:
Here we see the breakdown of each event for this specific ad group targets the 24-34 age range. Of the 1.100 installs, 15.1% converted to trial, 5.9% converted to subscription and 4.9% converted to purchase. We have 51 purchases from this ad group in one month. Now let’s use the funnel page for the 35-44 age ranged ad group:
In this ad group, there are 496 installs, 17.3% of them converted to trial, 6.9% of them converted to subscription and 6.5% converted to purchase. We have 32 goals generated in total in 1 month. And lastly, let’s see the performance of 45-54 age range for this app:
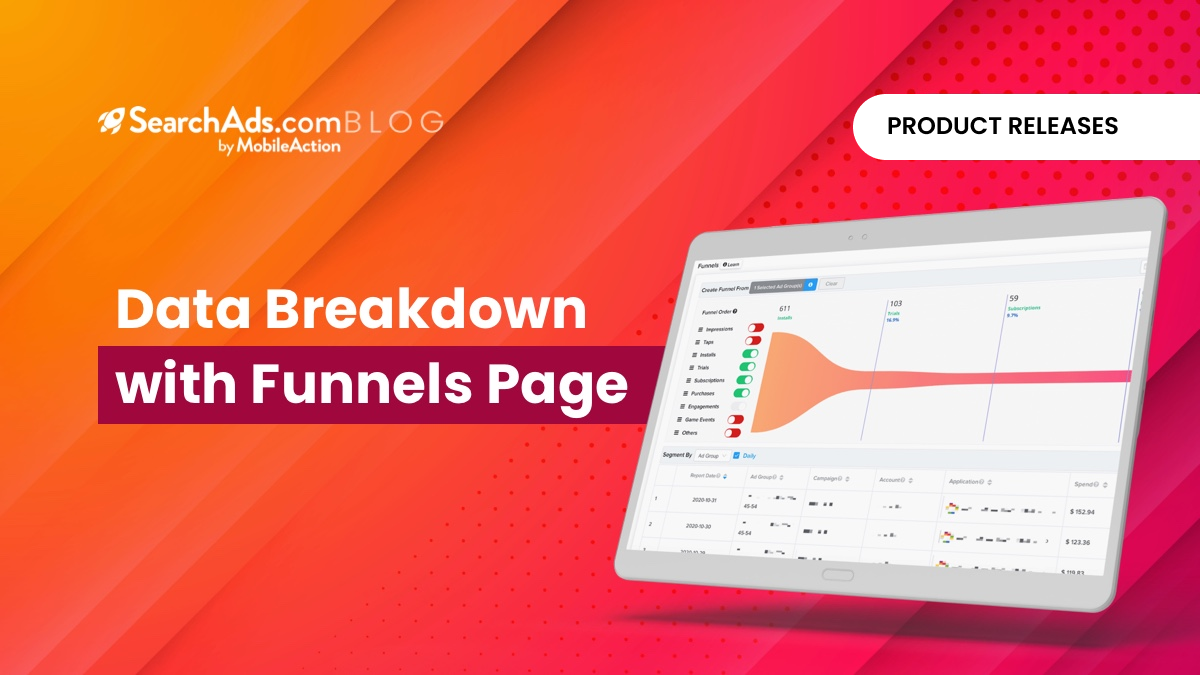
In this last ad group, we observe that there are 611 installs, 16.9% of them converted to trial, 9.7% converted to subscription and 9.8% converted to purchase. 60 goals are generated from this ad group in 1 month. In a few clicks, you can come to the conclusion that your primary target should be the 45-54 age for this specific app. Then, you may consider focusing on 35-44 age range secondarily. With this deduction, you get to know your audience better and can make wiser optimizations and updates accordingly.
Another similar example of the usage of the funnels is to find your target audience according to the keyword genre in your ad groups.
Let’s say that you have a casino app. In your Generic campaign, you have 4 different ad groups that are divided into “poker, card, relative, wide” genre. You can select these ad groups and compare their performance to come to the conclusion that your app is utilized more by one of these user types. Let’s see an example.
In other words, you can quickly decide on your future steps like “The keywords related to poker acquire more installs and purchases and performs more effectively when compared to the other genres. So maybe I should consider focusing on optimizing these keywords, or maybe I can highlight the poker-related features of my app in the next update. I may place them in the creatives as well”. This kind of decision regarding the keywords to be used in the metadata the next update is going to help you improve your ASO (App Store Optimization) too. By using the funnels page, you can draw a roadmap and optimize your campaigns accordingly.
Funnels page allows comparing the performances of different storefronts, campaigns & ad groups.
Let’s assume that you are managing multiple campaigns on different storefronts with multiple ad groups within each of them. And surely, you need to check the performance. We know that it takes so much time to analyze, compare, and contrast the data of each of them.
With the funnels page, you can simply choose the campaigns/ad groups you want to compare and see the difference explicitly within seconds. Suppose that you need to report the performance of the ad groups in the previous example. Instead of checking them one by one and to complete your analysis, you can simply choose all 3 of the ad groups and compare them easily along with a graph visualization.
First, let’s choose the ad groups to compare: Brand, Non-Brand, and Competitor campaigns in the US storefront.
When we click on “Apply”, we will immediately see the data of each of these campaigns. You may prefer to see it on a daily basis or aggregated, it is up to you. Since we are comparing more than one campaign here, it will be better to see this comparison as aggregated.
We can clearly see that compared to the US – Brand and US – Competitor campaigns, the US – Non-Brand campaign works by far the best considering the Goals Revenue and the number of attributed installs.
This can be applied to different storefronts as well. Say you want to compare the performances of US and UK campaigns. You can simply select these campaigns and see the data on the Funnels page in seconds.
We would be glad to show you the other features of SearchAds.com that save so much time and simplify Apple Search Ads activities. Schedule a demo with our Apple Search Ads experts, to discuss the best ways to optimize your Apple Search Ads campaigns and share our expertise with you.


