We’ve been working extremely hard to make a comprehensive and easy to use keyword optimization feature for you. With Keyword Trends – add up to 5 keywords side by side and observe their changes in Popularity along with a detailed breakdown of the Share of Voice for those keywords.
As promised to YOU, we are constantly in the works of adding new features and improving existing ones so that you have a seamless App Store Optimization experience on our dashboard.
We absolutely loved how you’ve already welcomed the improvements made by us to the ‘Keywords Suggestion’ feature and how quickly most of you have adopted it!
Make sure you continue to give us your feedback and suggestions as we find that really useful while deciding on what improvements to make to our platform.
Following up on our promise – We now introduce you to the brand new feature, Keyword Trends!
In this post, we’ll show you how you can incorporate it in your overall ASO strategy to make it more efficient.
Keyword Optimization & ASO
A large chunk of ASO resolves around Keyword Optimization. Therefore, selecting the best keywords for your app, is essential if you’d like to see an increase in your apps organic downloads.
While carrying out ASO, It’s a common practice to decide which keywords to focus on, simply by looking at the following 3 values for a keyword:
– Popularity or Volume = How often it’s searched for in the App stores
– Chance = How easy it is to rank in the top 10 for it
– Total Apps = The total amount of apps that rank on it
There is nothing wrong with this practice as it covers the most important details you need to know about any keyword. However, this practice is incomplete as there’s a lot more to a keyword than the above mentioned scores.
Keyword Trends will provide you the extra information about the keywords that will help you identify and select the best ones for you to work with.
Keyword Trends
1. Popularity
This new feature is divided into 2 sections. On the top of the page is where you will see the current Popularity and the Popularity History for up to 5 keywords, for the date range and country you’ve selected.
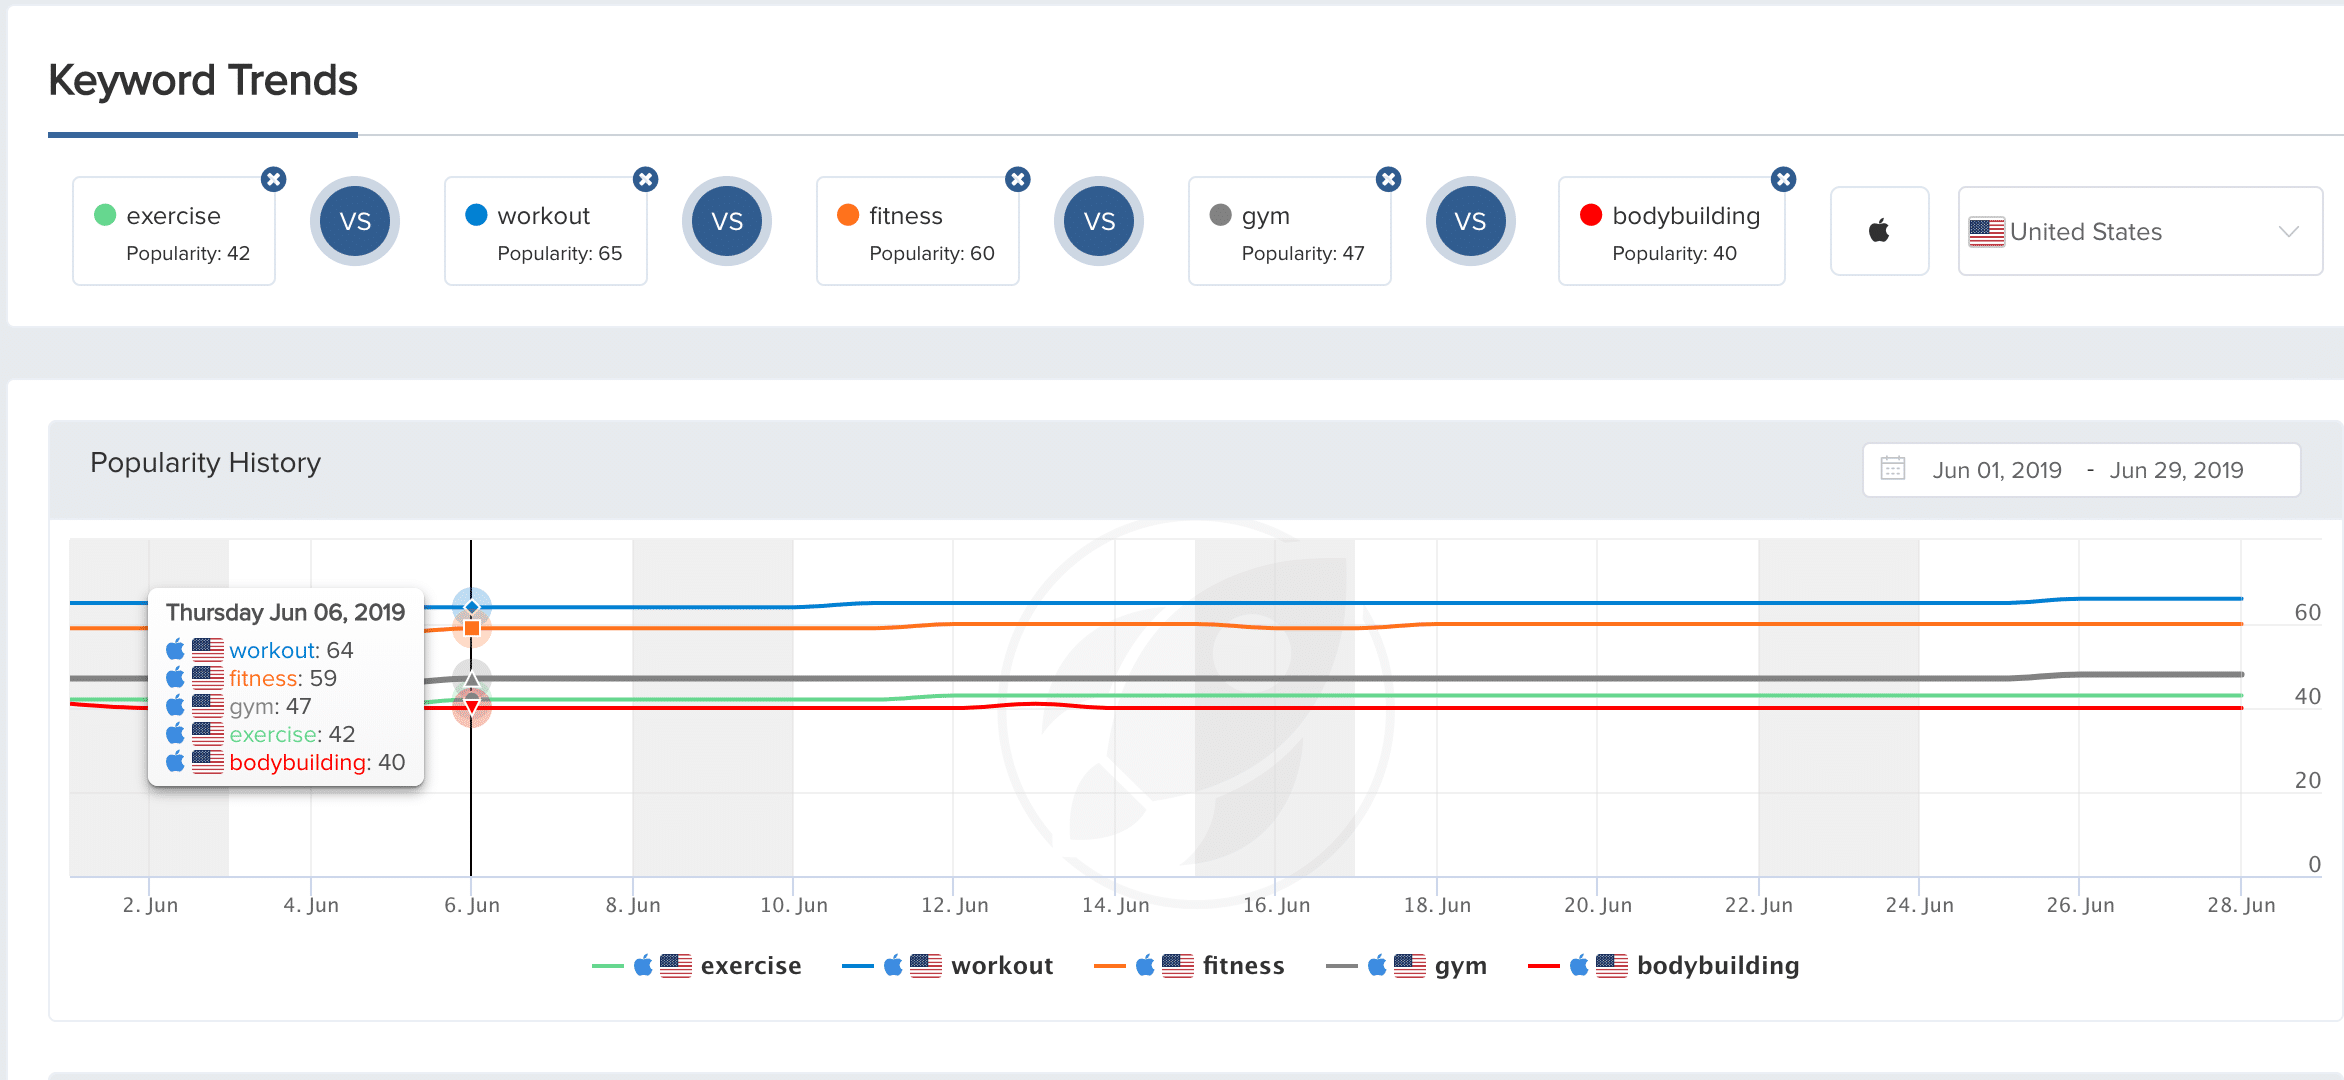
Here you’ll be able to identify which keywords are more popular than others. The graph also makes it easy to spot any trends in the popularity of the keywords.
2. Share of Voice
And then there’s Share of Voice! This is where you’ll find out the intricacies of those selected keywords that are often ignored while carrying out Keyword Optimization. Having this knowledge will improve your overall ASO drastically!
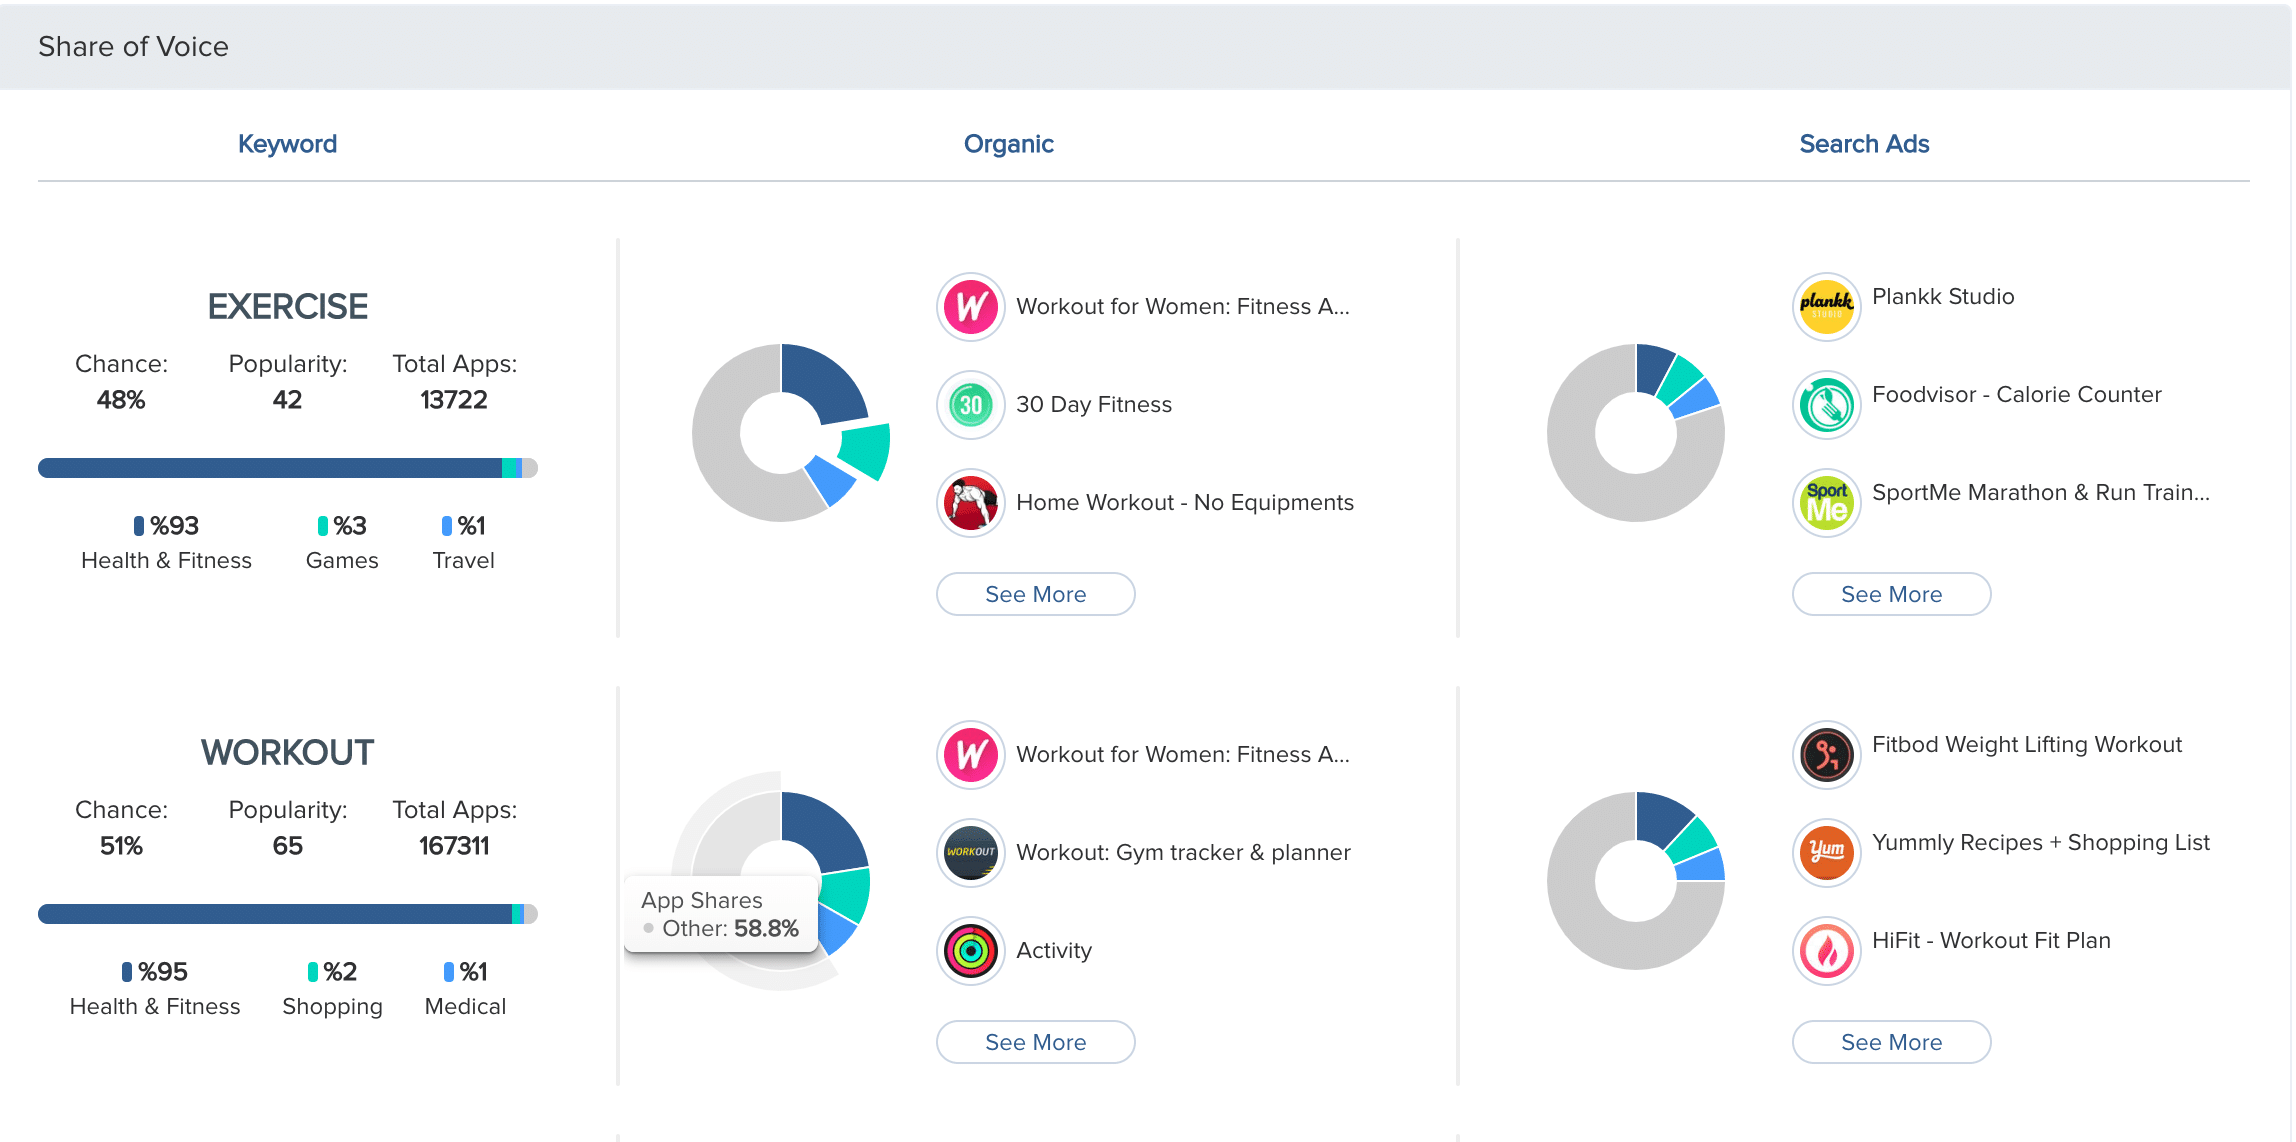
Under the Share of Voice, you’ll have the following information for each of the 5 keywords that you’ve selected:
- Share of Voice by Category
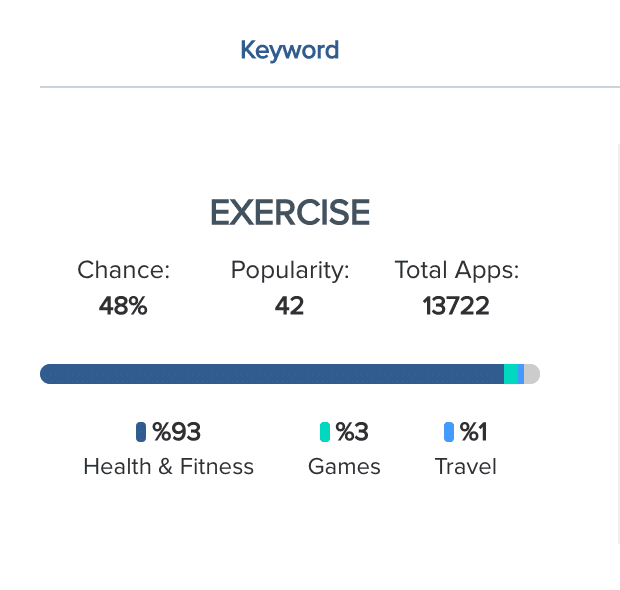
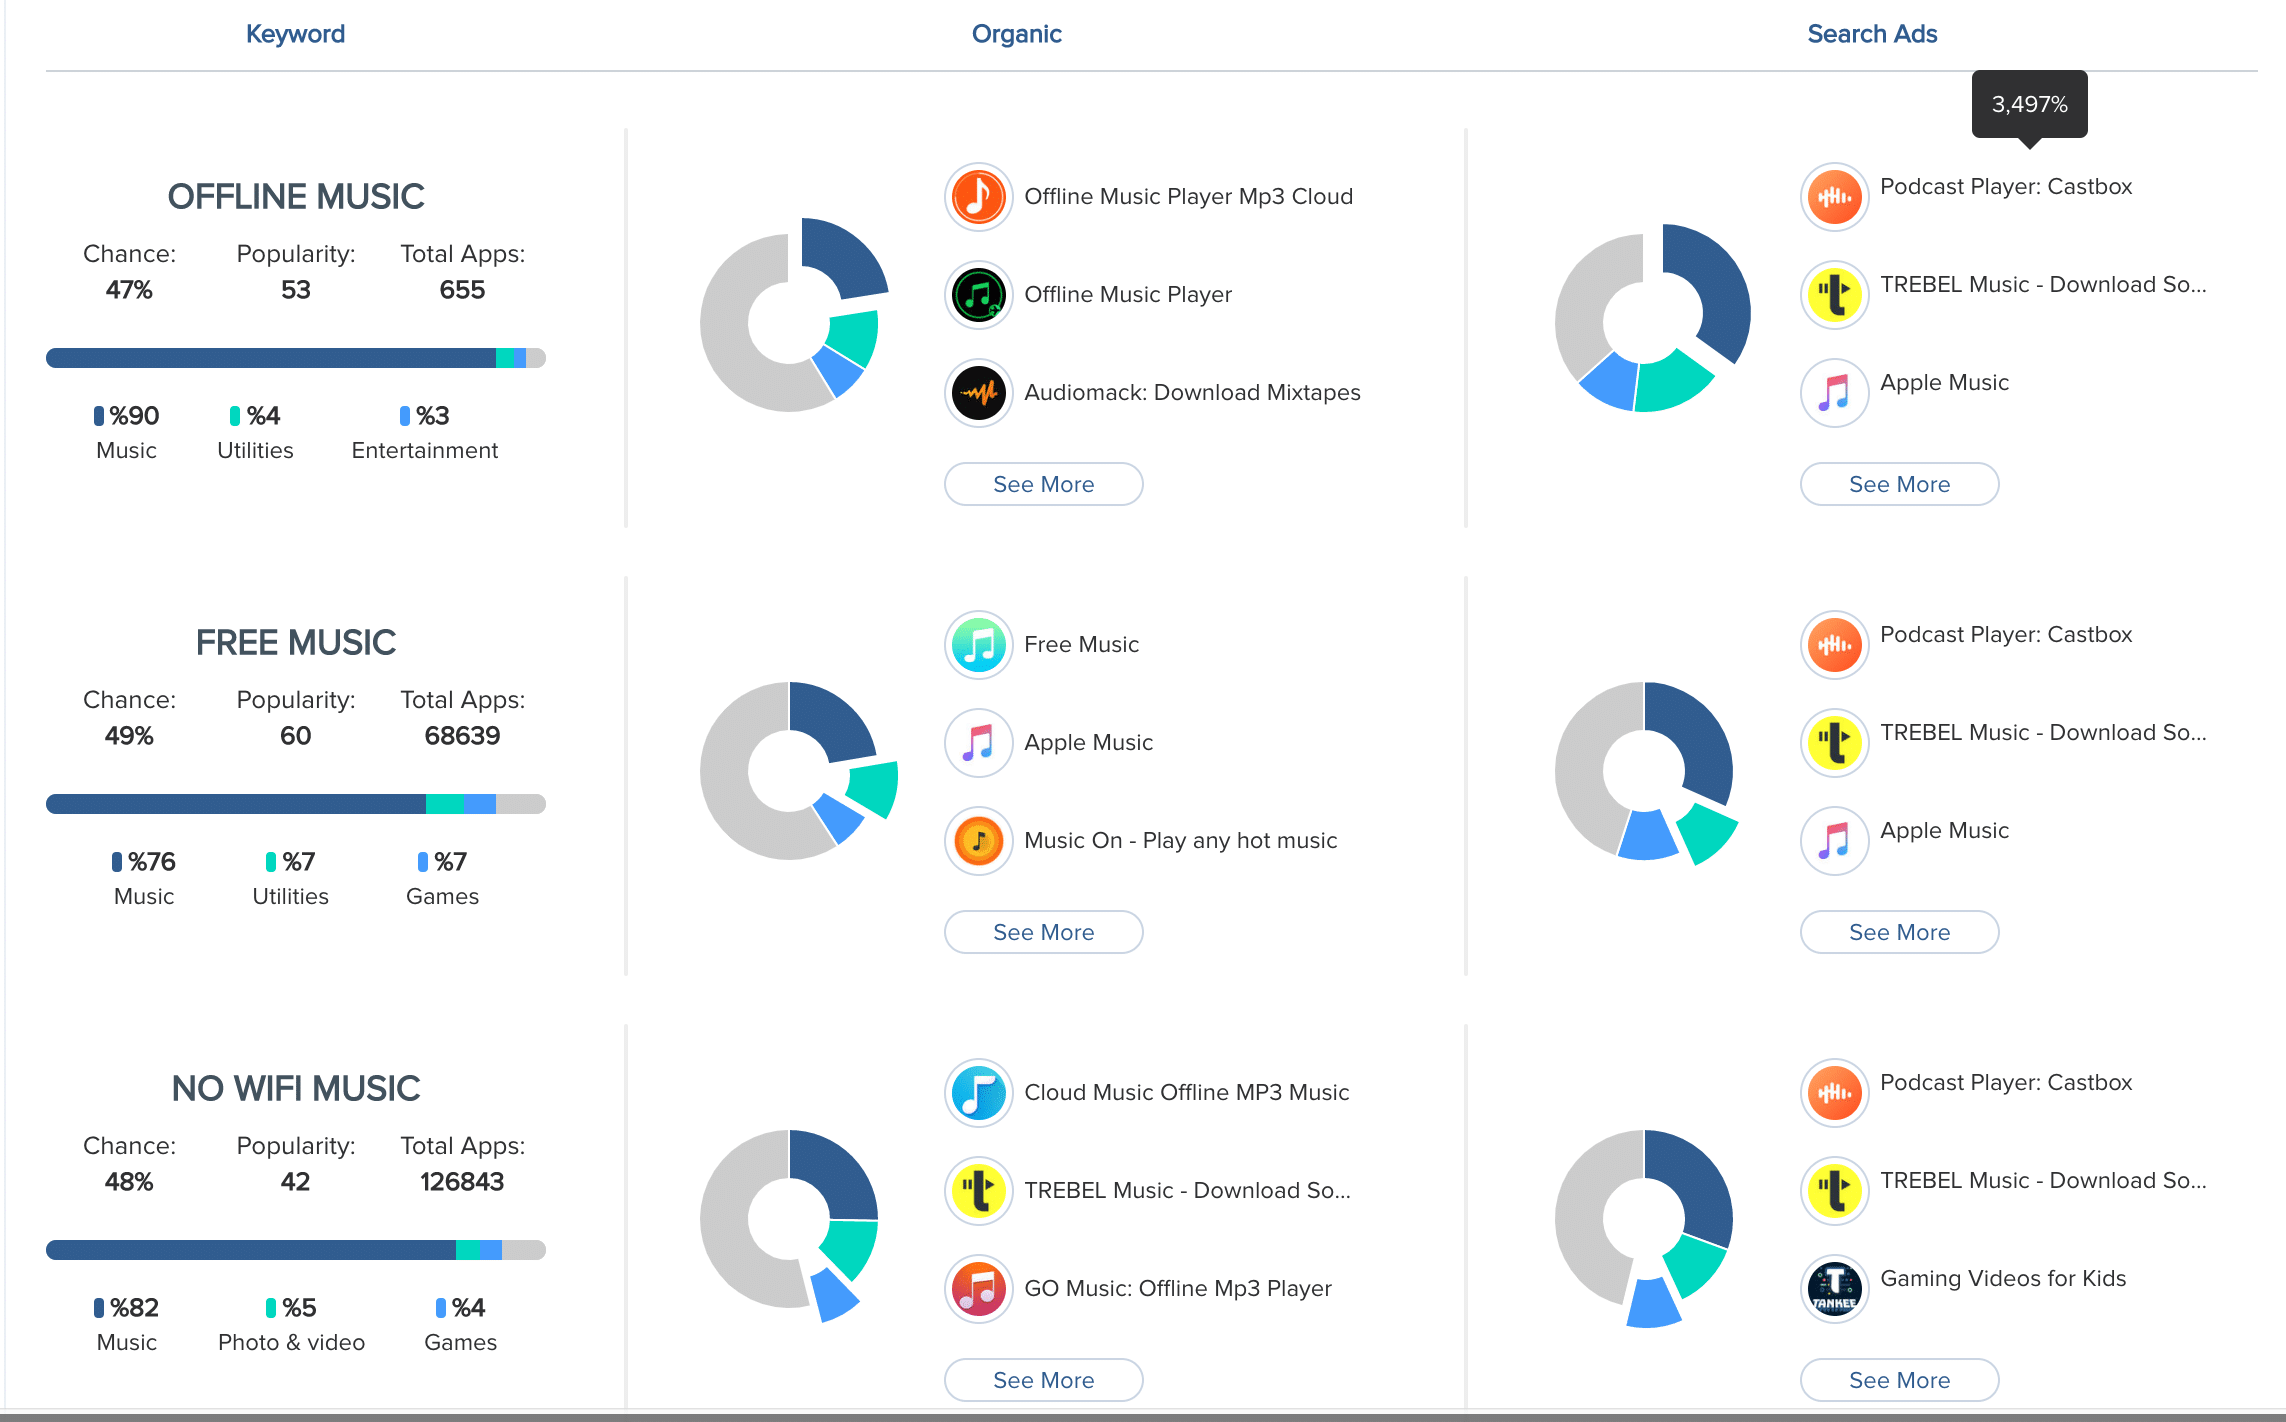
This shows how popular a keyword is among apps in different categories. The keyword ‘Exercise’ for instance, is used mostly by apps in the Health & Fitness category (93% to be exact). This is important as Apple Play Store allows you to choose only 2 categories (Primary and Secondary) per app. According to Apple, ‘The primary category that you select is particularly important for your app’s discoverability on the App Store’. Therefore, it is necessary to select a keyword for which your category has the largest % share, as your organic downloads will quite often come from people searching for apps in those categories.
- Share of Organic Voice by Apps
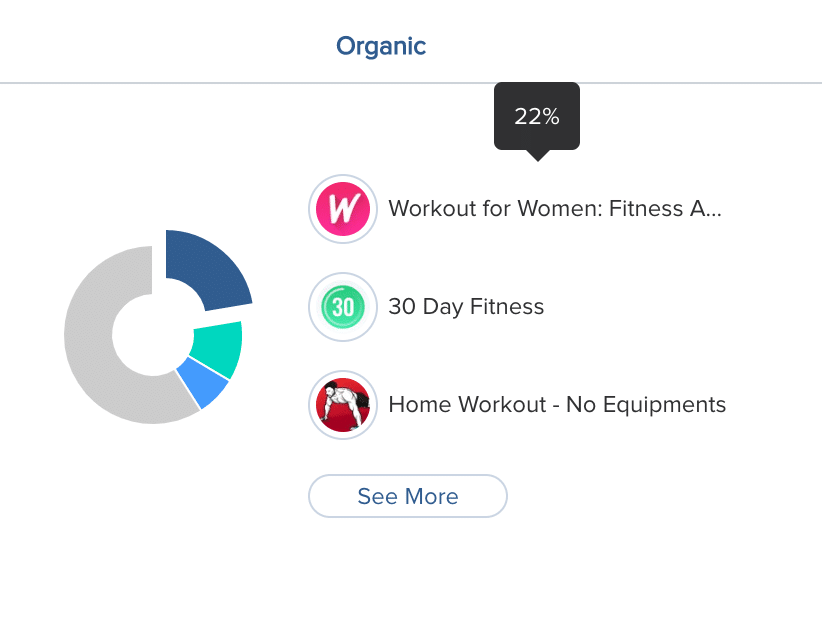
Taking a look at the organic share of voice gives us an insight about which apps are receiving the most taps organically. It also shows the power of using keywords in the title of your app. This combined with all the different competitive analysis features already existing on our platform will help you identify other similar keywords for which these apps are bringing in most downloads for. You can then incorporate those keywords in your ASO to get the results you are looking for with your app.
- Share of Inorganic Voice by Apps
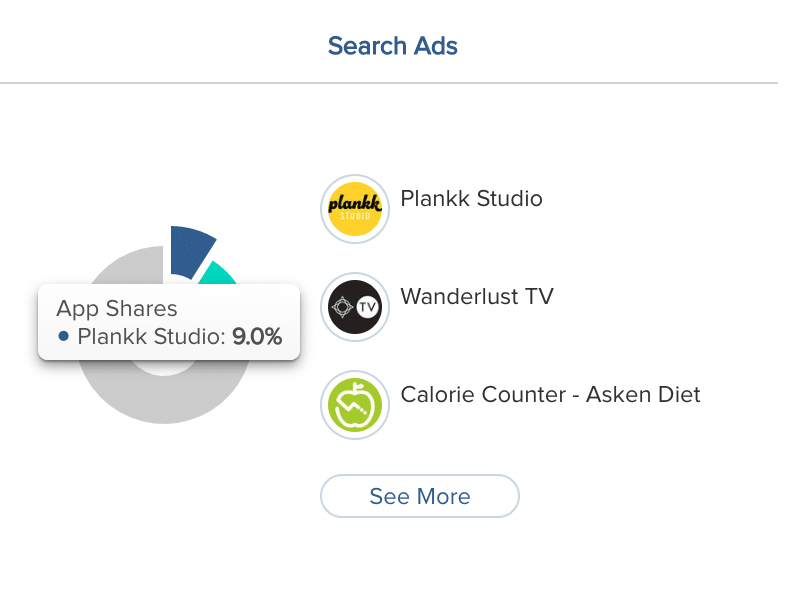
The inorganic share of voice shows which app is receiving the most impressions for their Apple SearchAds for the keywords that you’re interested in. This is important as the inorganic voice has an effect on the organic voice as well. It also shows who your potential competitors are and how much inorganic share of voice they have for a keyword which will be helpful if you are deciding to run ads on it too.
Since we’ve gotten that out of the way, let’s go over some example keywords to see what insights you’ll be able to derive and how that’s going to help you with your ASO!
Example and Analysis:
Let’s assume that you have a music app that provides music to its users for free. You’ll be able to use the Keyword Trends page to research about up to 5 keywords at a time and then select the best ones for your app. For simplicity, let’s assume that the Keywords you’ve decided to choose are; ‘Offline Music’, ‘Free Music’ and ‘No Wifi Music’ (for this examples, we’ll work with only 3).
All you have to do is: Select the Keyword, Choose any date range and add the Keywords!
1. Popularity
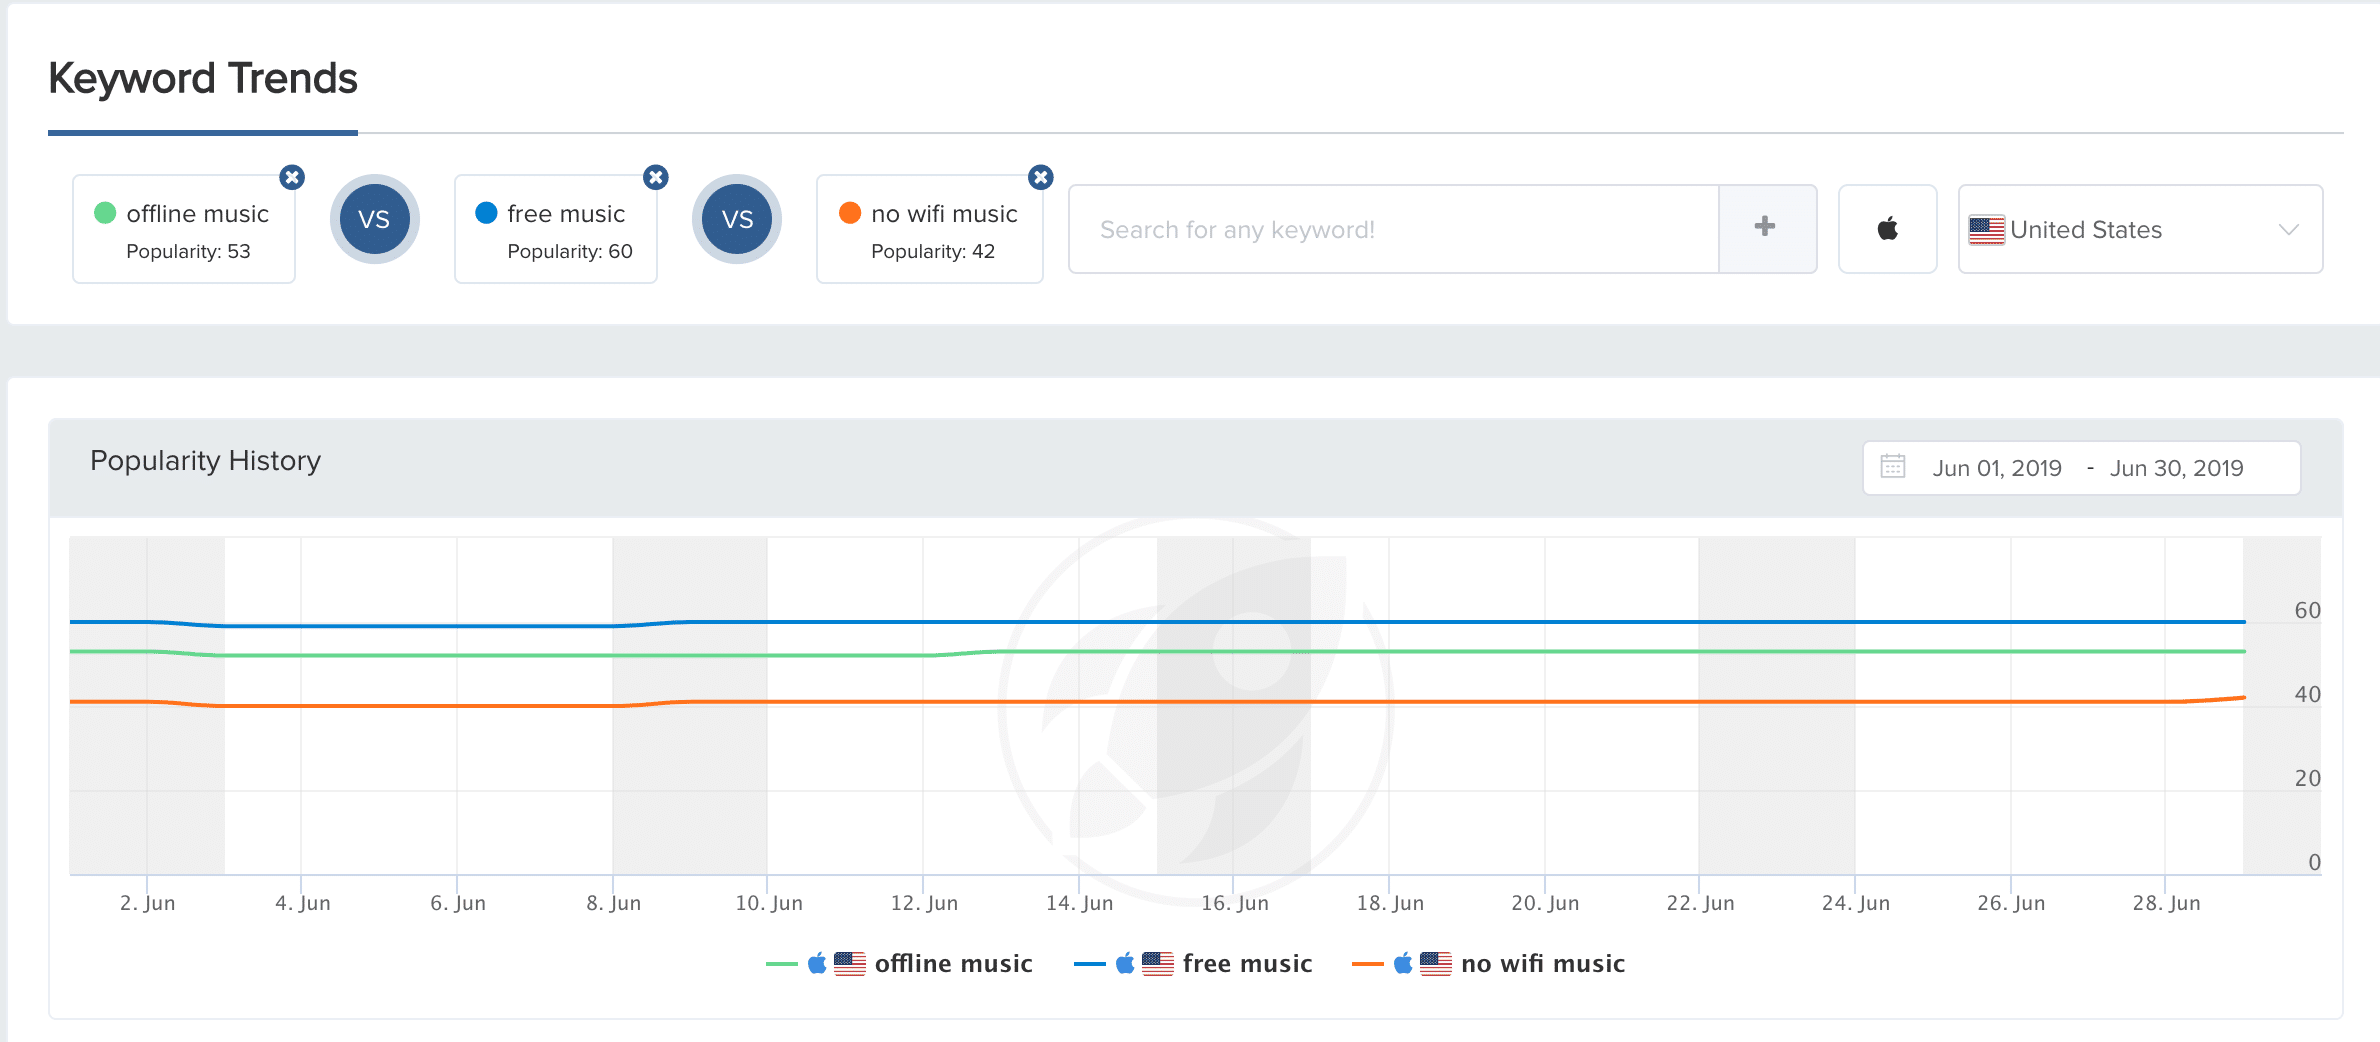
Right off the bat, you can see that popularity of the 3 keywords hasn’t fluctuated much in the entire month of June. Which means you can be certain that there shall be no major dips or ascents in any of the keywords’ popularity in the near future. So you do not have to take that into consideration while deciding upon their worth for your app.
2. Share Of Voice
Share of Voice by Category
Simply by looking at their Chance, Popularity and Total Apps you might think that ‘Free Music’ should be your favorite pick since it has the highest Chance and the highest Popularity.
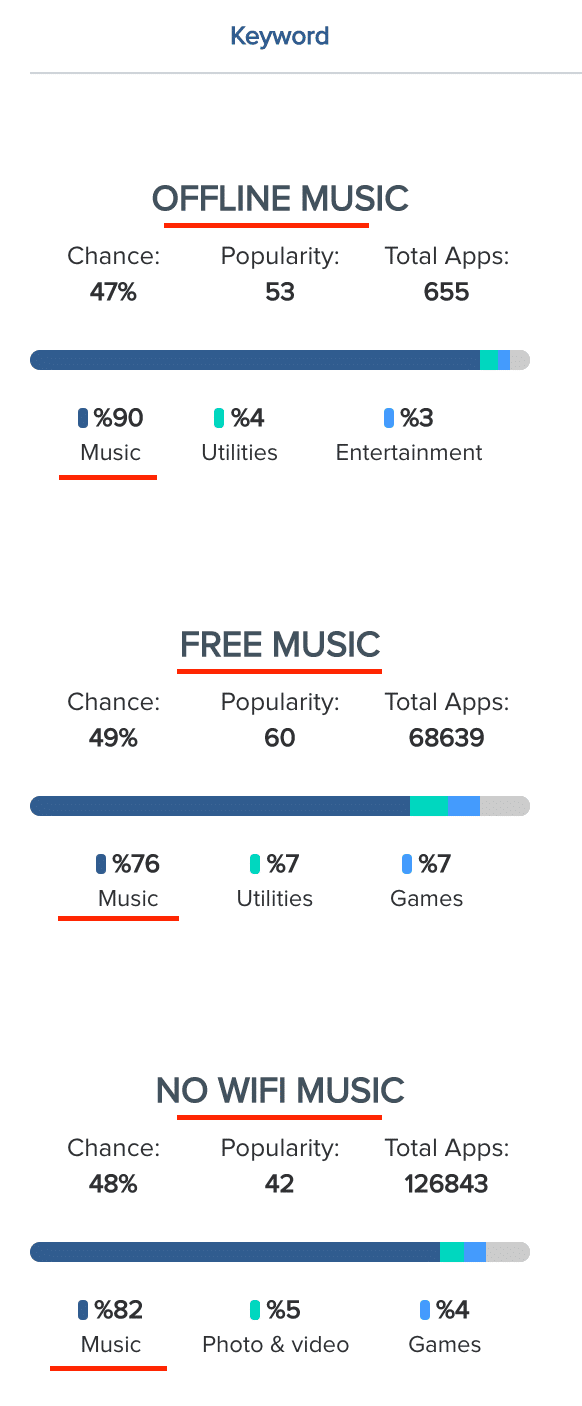
However, even though you assume the 3 keywords to belong to the same category, Apple App Store doesn’t. This is fairly obvious when looking at the % share by category. The keyword “Offline Music” is the only keyword that has 90% of its share in the Music Category while ‘Free Music’ and ‘No Wifi Music’ have a share of 76% and 82% respectively. As the primary category of your app is certainly ‘Music’: this is important! ‘Offline Music’ is also drastically less crowded compared to the other 2 keywords. Moreover, the Chance of all of the 3 keywords are almost the same and therefore a negligible factor in this analysis.
Share of Organic Voice by Apps
By comparing the organic voice of apps with the inorganic voice, you’re able to see how important it would be for you to incorporate a keyword in your title if you would like to rank high for it. For the Keyword ‘Offline Music’ for instance, the top 2 apps getting the most taps, both have the words ‘Offline Music’ at the very beginning of their names.
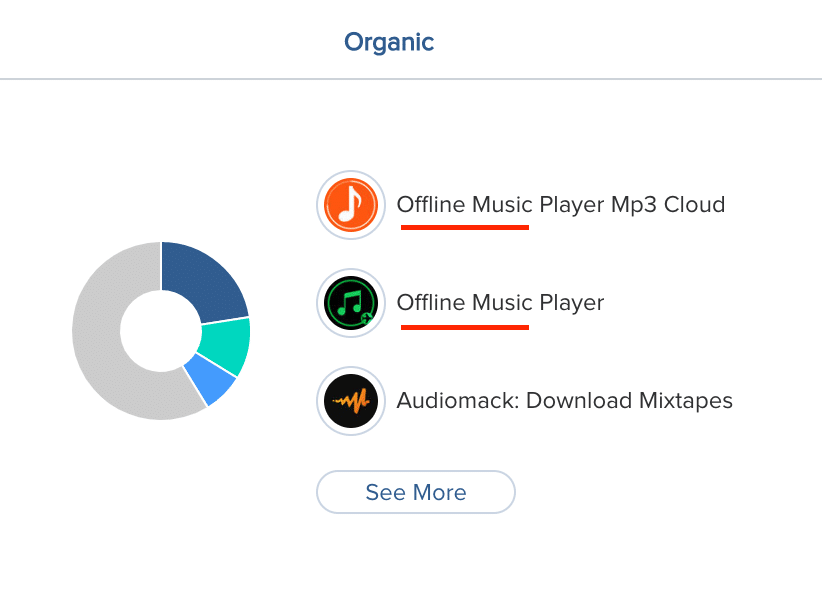
Contrary to this, the apps taking the most inorganic impressions do not have need to have the keywords in their title. This insight shows that it is extremely important to choose the right primary keyword for your app.
Share of Inorganic Voice by Apps
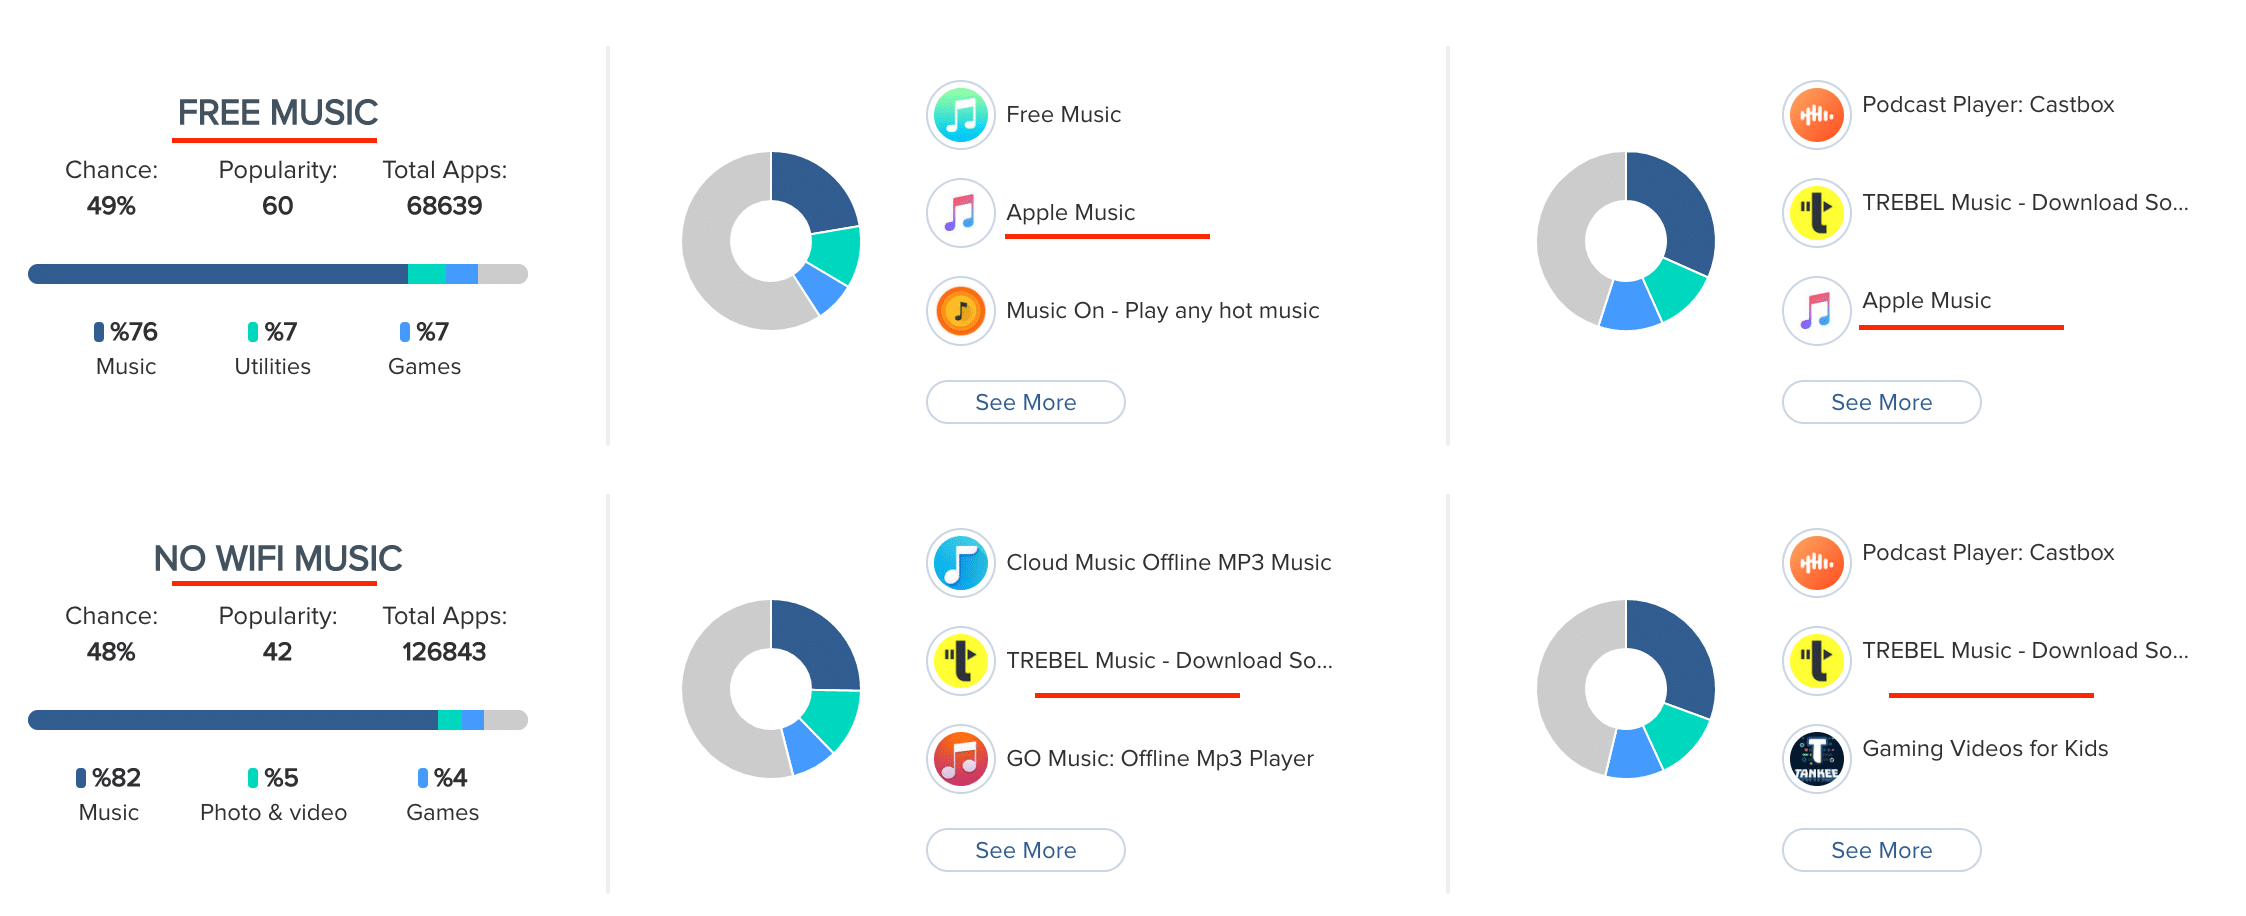
You’re able to see that for the keyword ‘Free Music’, the app ‘Apple Music’ has the 2nd largest share of the organic share of voice and are also running ads on it in order to increase their inorganic share of voice. Similarly, the app ‘TREBEL Music’ is doing the same on ‘No Wifi Music’. If they do not do so, this share of inorganic voice will be filled in by some other app. Spotting this is crucial you. If you see the opportunity, you could bid and increase your downloads for a keyword your app has a high Chance for. By doing so, you will in turn have an affect on your apps organic share of voice as well.
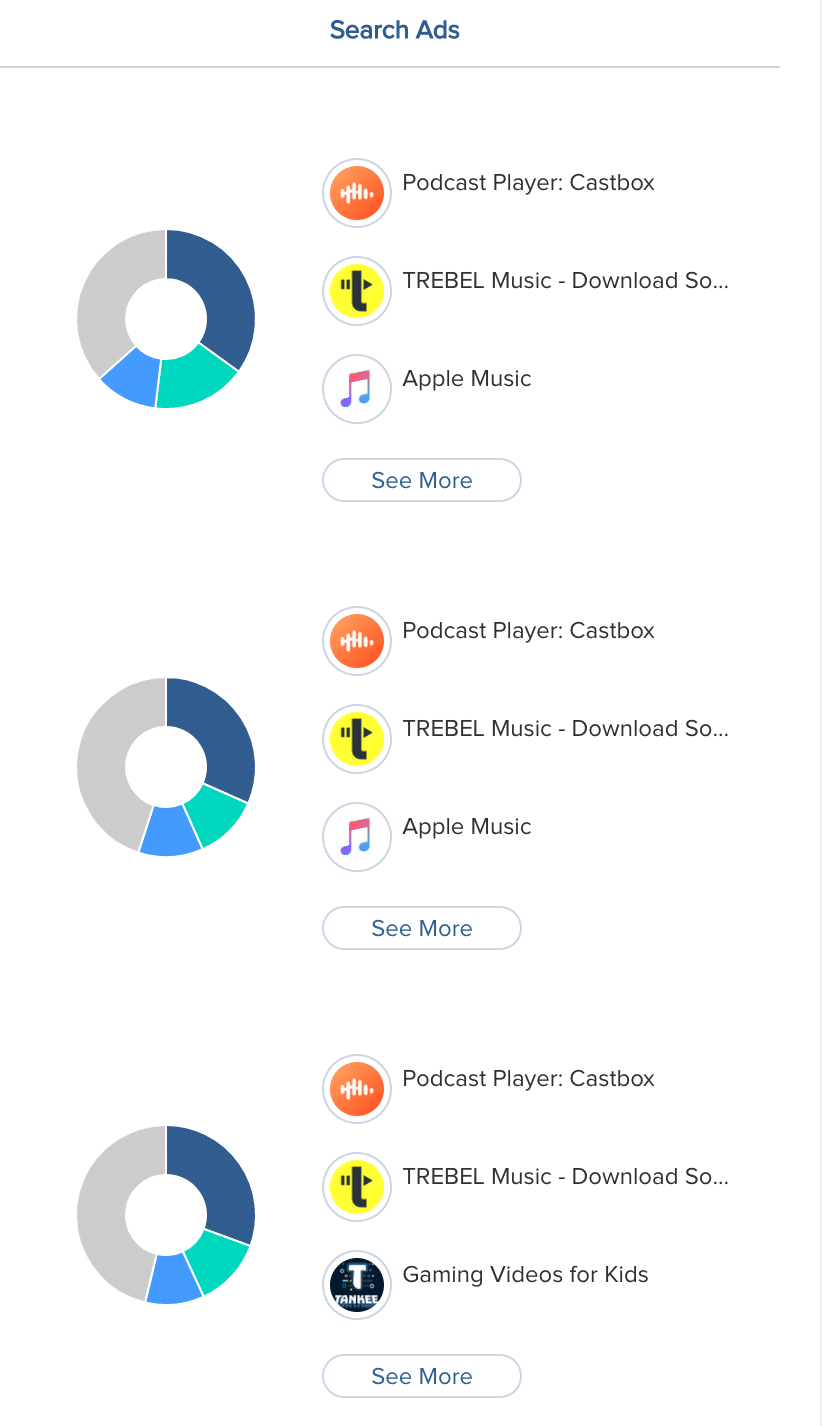
This module is also useful in identifying which app is most aggressive in terms of running ads. For instance, we can confidently say that the app ‘Podcast Player: Castbox’, is trying to snatch all the searches made by users who are looking for music that’s free. They are running ads on all 3 keywords of our interest and have the largest share of inorganic voice for these searches. Closely followed by the app ‘TREBEL Music’ and then ‘Apple Music’.
Come try it out!
You’ll find Keyword Trends under ASO basic in the ASO Intelligence module of our dashboard. Which means that you’ll have access to it if you are subscribed to any one of the plans that we offer on the pricing page!
Make sure you benefit from this new addition in your arsenal of already existing ASO features on the dashboard.
Feel free to reach out to us regarding any questions or queries
All The Best!
– Mobile Action Team
